

Green synthesis of graphene and its cytotoxic effects in human breast cancer cells
- PMID: 23687445
- PMCID: PMC3655623
- DOI: 10.2147/IJN.S42047
Green synthesis of graphene and its cytotoxic effects in human breast cancer cells
Abstract
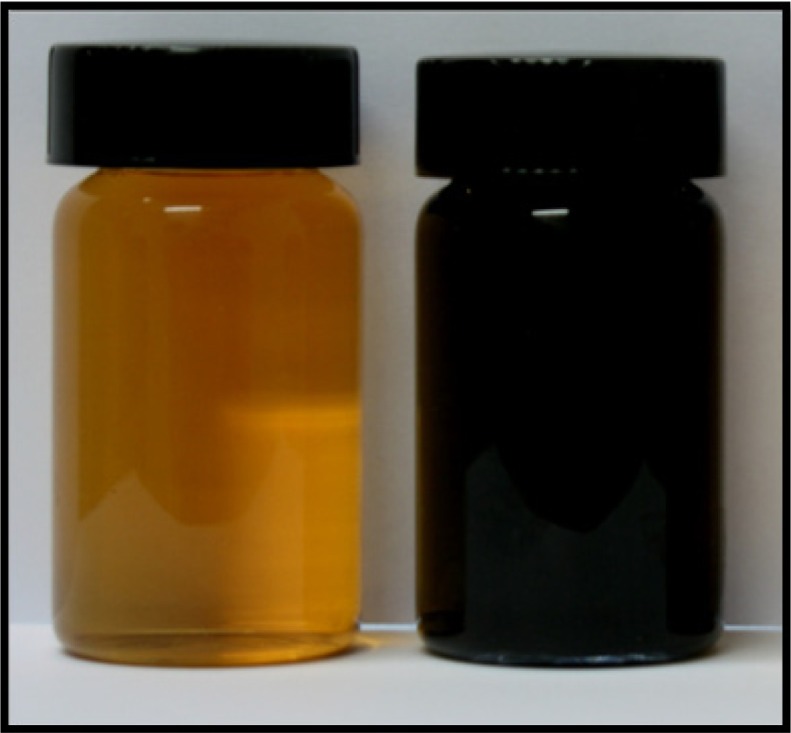
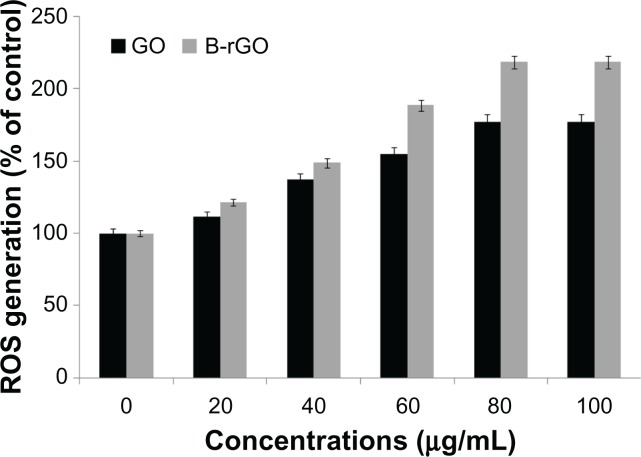
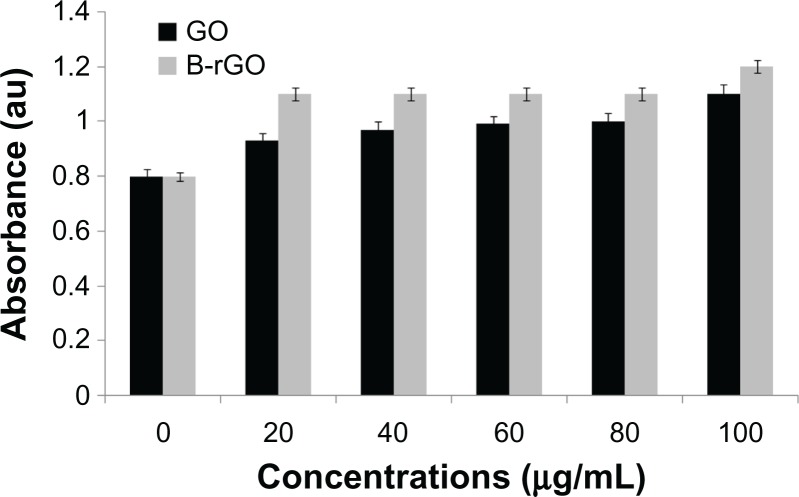
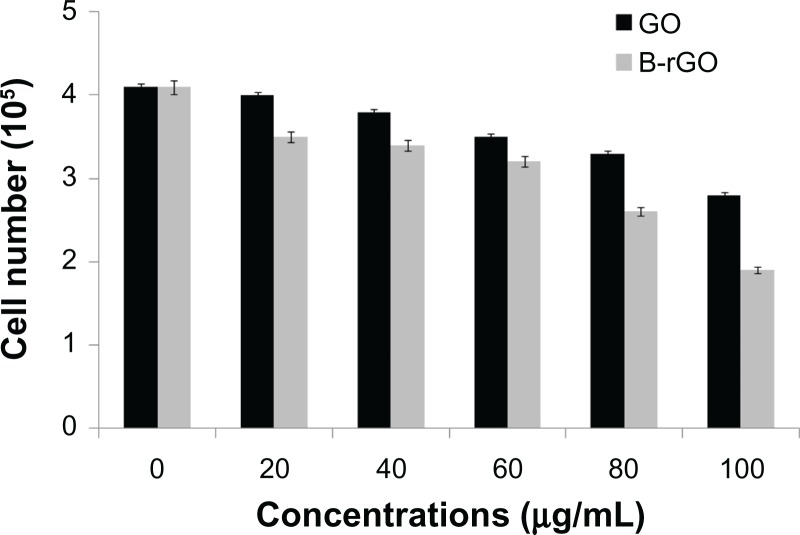
Background: This paper describes an environmentally friendly ("green") approach for the synthesis of soluble graphene using Bacillus marisflavi biomass as a reducing and stabilizing agent under mild conditions in aqueous solution. In addition, the study reported here investigated the cytotoxicity effects of graphene oxide (GO) and bacterially reduced graphene oxide (B-rGO) on the inhibition of cell viability, reactive oxygen species (ROS) generation, and membrane integrity in human breast cancer cells.
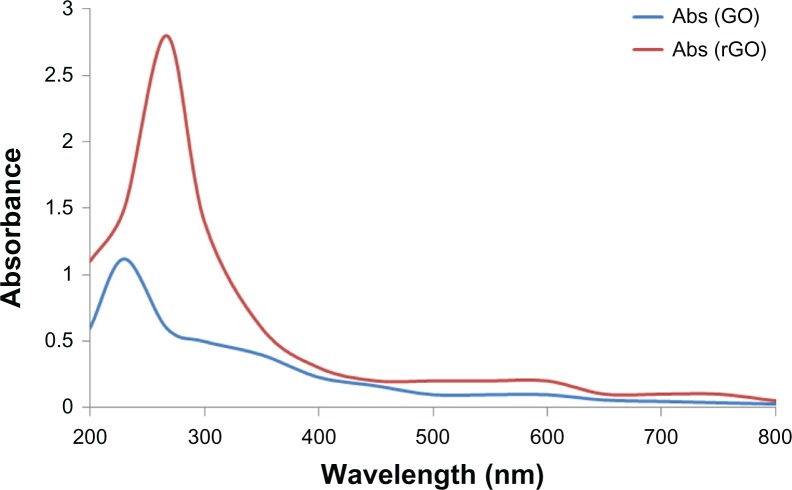
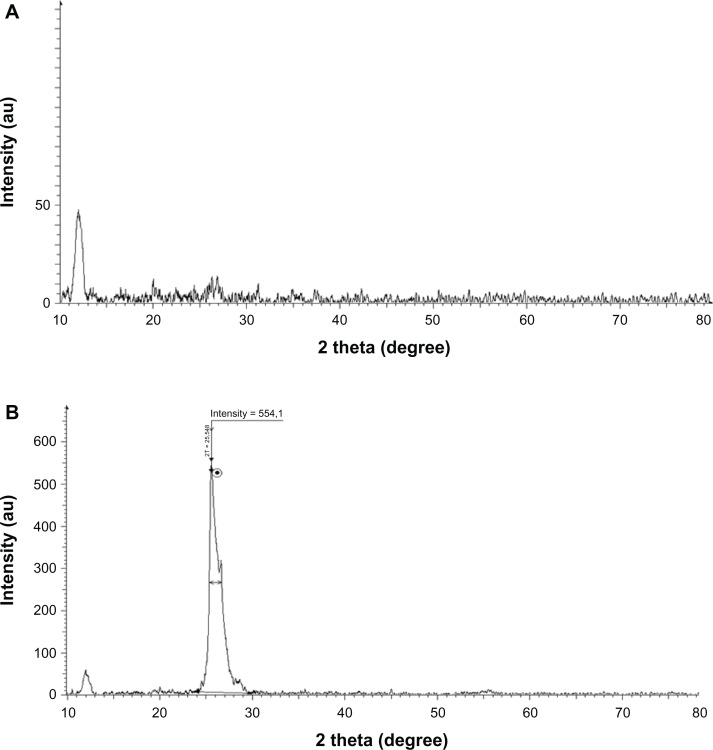
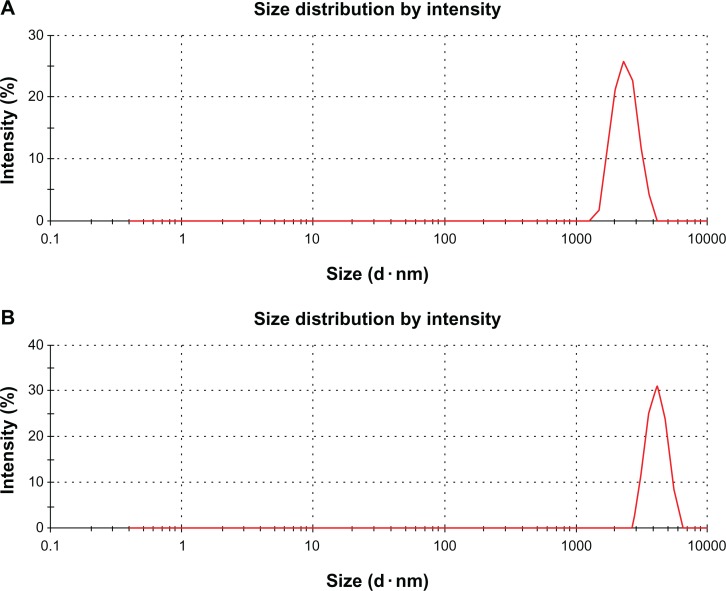
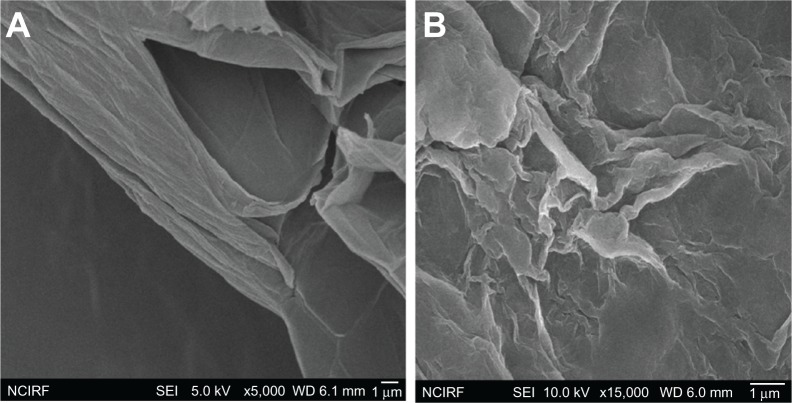
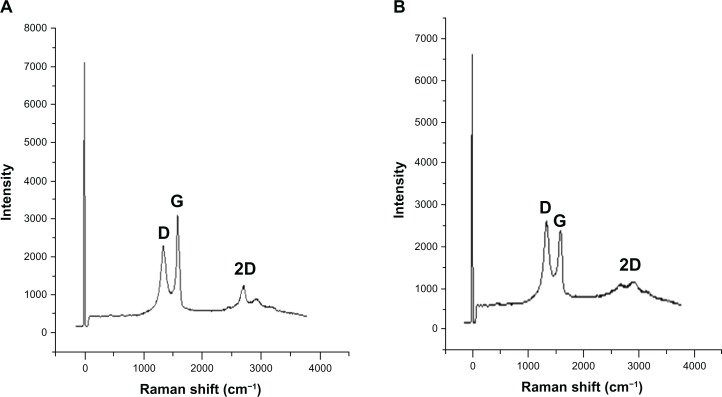
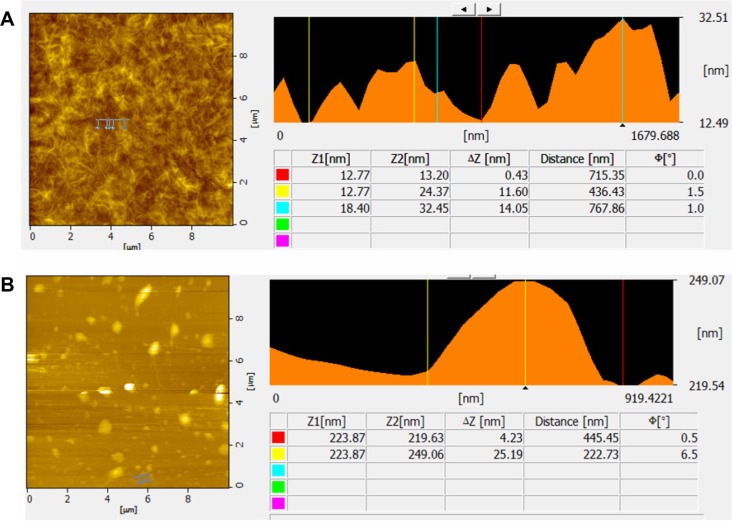
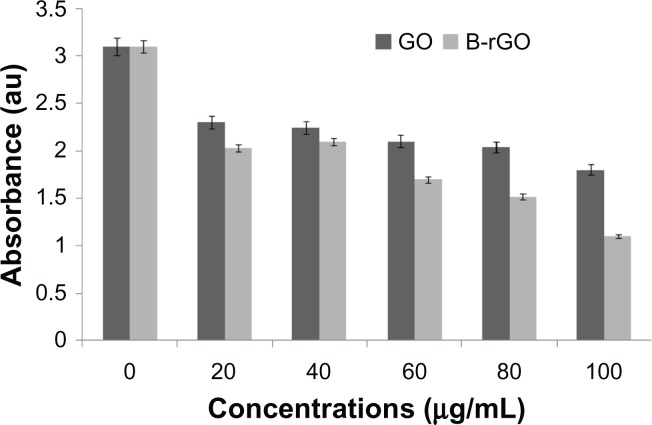
Methods: The reduction of GO was characterized by ultraviolet-visible spectroscopy. Size distribution was analyzed by dynamic light scattering. Further, X-ray diffraction and high-resolution scanning electron microscopy were used to investigate the crystallinity of graphene and the morphologies of prepared graphene, respectively. The formation of defects further supports the bio-functionalization of graphene, as indicated in the Raman spectrum of B-rGO. Surface morphology and the thickness of the GO and B-rGO were analyzed using atomic force microscopy, while the biocompatibility of GO and B-rGO were investigated using WST-8 assays on MCF-7 cells. Finally, cellular toxicity was evaluated by ROS generation and membrane integrity assays.
Results: In this study, we demonstrated an environmentally friendly, cost-effective, and simple method for the preparation of water-soluble graphene using bacterial biomass. This reduction method avoids the use of toxic reagents such as hydrazine and hydrazine hydrate. The synthesized soluble graphene was confirmed using various analytical techniques. Our results suggest that both GO and B-rGO exhibit toxicity to MCF-7 cells in a dose-dependent manner, with a dose > 60 μg/mL exhibiting obvious cytotoxicity effects, such as decreasing cell viability, increasing ROS generation, and releasing of lactate dehydrogenase.
Conclusion: We developed a green and a simple approach to produce graphene using bacterial biomass as a reducing and stabilizing agent. The proposed approach confers B-rGO with great potential for various biological and biomedical applications.
Keywords: Bacillus marisflavi; Raman spectroscopy; graphene oxide; reduced graphene oxide; ultraviolet–visible spectroscopy.
Figures
Similar articles
-
An in vitro evaluation of graphene oxide reduced by Ganoderma spp. in human breast cancer cells (MDA-MB-231).Int J Nanomedicine. 2014 Apr 8;9:1783-97. doi: 10.2147/IJN.S57735. eCollection 2014. Int J Nanomedicine. 2014. PMID: 24741313 Free PMC article.
-
Green chemistry approach for the synthesis of biocompatible graphene.Int J Nanomedicine. 2013;8:2719-32. doi: 10.2147/IJN.S45174. Epub 2013 Jul 31. Int J Nanomedicine. 2013. PMID: 23940417 Free PMC article.
-
Ginkgo biloba: a natural reducing agent for the synthesis of cytocompatible graphene.Int J Nanomedicine. 2014;9:363-77. doi: 10.2147/IJN.S53538. Epub 2014 Jan 7. Int J Nanomedicine. 2014. PMID: 24453487 Free PMC article.
-
Bio-reduction of Graphene Oxide: Catalytic Applications of (Reduced) GO in Organic Synthesis.Curr Org Synth. 2020;17(3):164-191. doi: 10.2174/1570179417666200115110403. Curr Org Synth. 2020. PMID: 32538718 Review.
-
Green Carbon Nanostructures for Functional Composite Materials.Int J Mol Sci. 2022 Feb 6;23(3):1848. doi: 10.3390/ijms23031848. Int J Mol Sci. 2022. PMID: 35163770 Free PMC article. Review.
Cited by
-
Toxicity of graphene-family nanoparticles: a general review of the origins and mechanisms.Part Fibre Toxicol. 2016 Oct 31;13(1):57. doi: 10.1186/s12989-016-0168-y. Part Fibre Toxicol. 2016. PMID: 27799056 Free PMC article. Review.
-
Combination Effect of Silver Nanoparticles and Histone Deacetylases Inhibitor in Human Alveolar Basal Epithelial Cells.Molecules. 2018 Aug 15;23(8):2046. doi: 10.3390/molecules23082046. Molecules. 2018. PMID: 30111752 Free PMC article.
-
Co-Sn-Cu oxides/graphene nanocomposites as green catalysts for preparing 1,8-dioxo-octahydroxanthenes and apoptosis-inducing agents in MCF-7 human breast cancer cells.IET Nanobiotechnol. 2021 Apr;15(2):197-211. doi: 10.1049/nbt2.12006. Epub 2021 Feb 22. IET Nanobiotechnol. 2021. PMID: 34694698 Free PMC article.
-
Novel biomolecule lycopene-reduced graphene oxide-silver nanoparticle enhances apoptotic potential of trichostatin A in human ovarian cancer cells (SKOV3).Int J Nanomedicine. 2017 Oct 13;12:7551-7575. doi: 10.2147/IJN.S144161. eCollection 2017. Int J Nanomedicine. 2017. PMID: 29075115 Free PMC article.
-
Exploring the Potential of Mitochondria-Targeted Drug Delivery for Enhanced Breast Cancer Therapy.Int J Breast Cancer. 2025 Mar 3;2025:3013009. doi: 10.1155/ijbc/3013009. eCollection 2025. Int J Breast Cancer. 2025. PMID: 40224721 Free PMC article. Review.
References
-
- Loh KP, Bao Q, G.Eda G, Chhowalla M. Graphene oxide as a chemically tunable platform for optical applications. Nat Chem. 2010;2(12):1015–1024. - PubMed
-
- Geim KA, Novoselov KS. The rise of graphene. Nat Mater. 2007;6(3):183–191. - PubMed
-
- Dreyer DR, Park S, Bielawski CW, Ruoff RS. The chemistry of graphene oxide. Chem Soc Rev. 2010;39(1):228–240. - PubMed
-
- Novoselov KS, Geim AK, Morozov SV, et al. Electric field effect in atomically thin carbon films. Science. 2004;306(5696):666–669. - PubMed
-
- Stankovich S, Dikin DA, Piner RD, et al. Synthesis of graphene-based nanosheets via chemical reduction of exfoliated graphite oxide. Carbon. 2007;45:1558–1565.
Publication types
MeSH terms
Substances
LinkOut - more resources
Full Text Sources
Other Literature Sources
