

IN VITRO QUANTIFICATION OF THE SIZE DISTRIBUTION OF INTRASACCULAR VOIDS LEFT AFTER ENDOVASCULAR COILING OF CEREBRAL ANEURYSMS
- PMID: 23687520
- PMCID: PMC3653595
- DOI: 10.1007/s13239-012-0113-7
IN VITRO QUANTIFICATION OF THE SIZE DISTRIBUTION OF INTRASACCULAR VOIDS LEFT AFTER ENDOVASCULAR COILING OF CEREBRAL ANEURYSMS
Abstract
Purpose: Endovascular coiling of cerebral aneurysms remains limited by coil compaction and associated recanalization. Recent coil designs which effect higher packing densities may be far from optimal because hemodynamic forces causing compaction are not well understood since detailed data regarding the location and distribution of coil masses are unavailable. We present an in vitro methodology to characterize coil masses deployed within aneurysms by quantifying intra-aneurysmal void spaces.
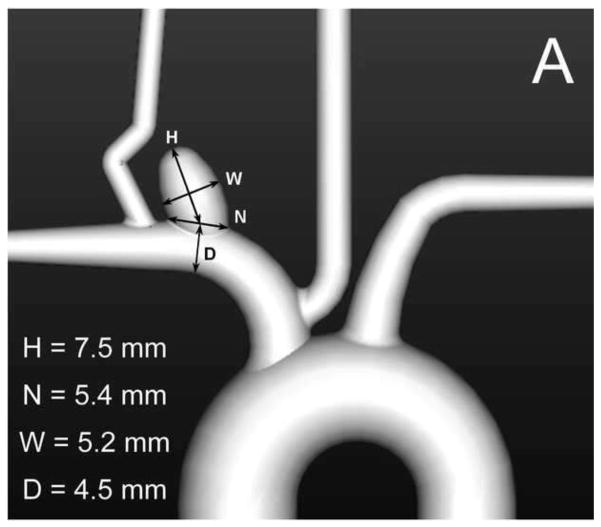
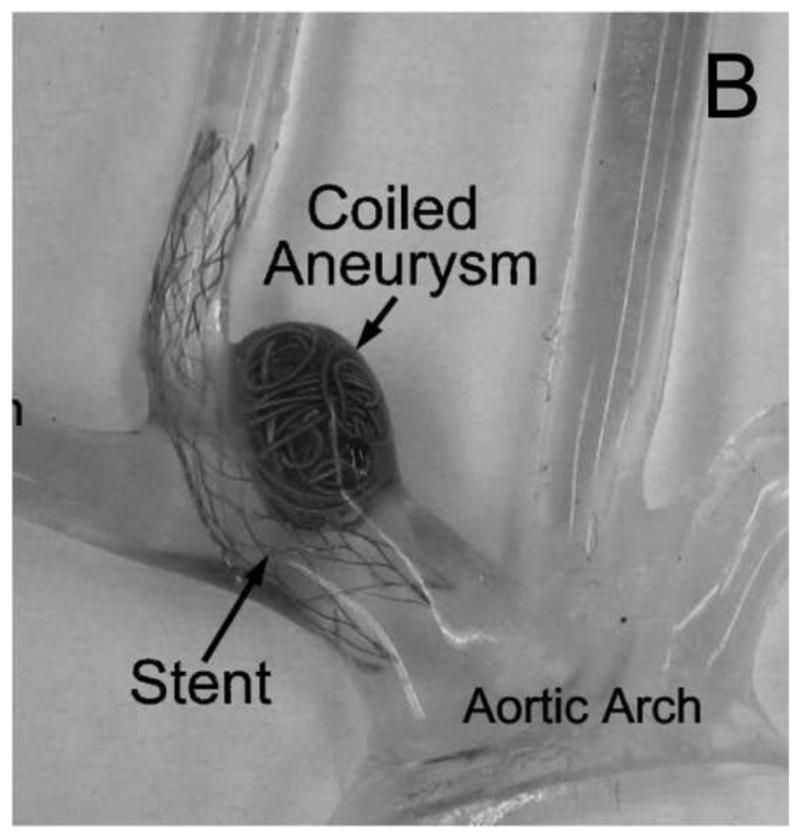
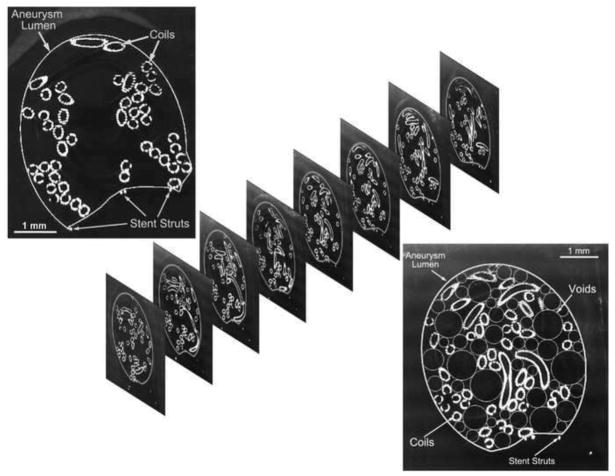
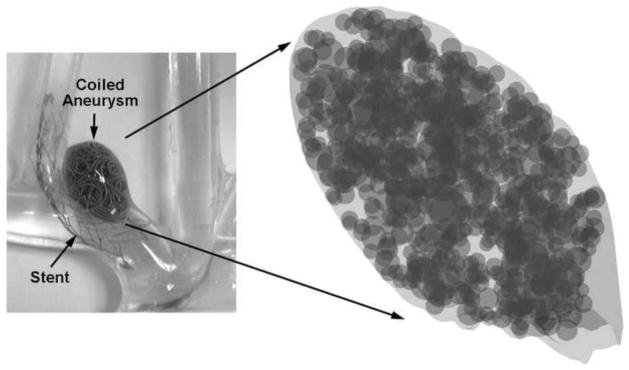
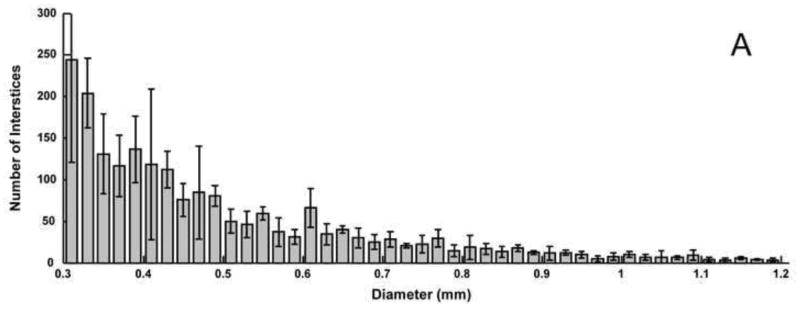
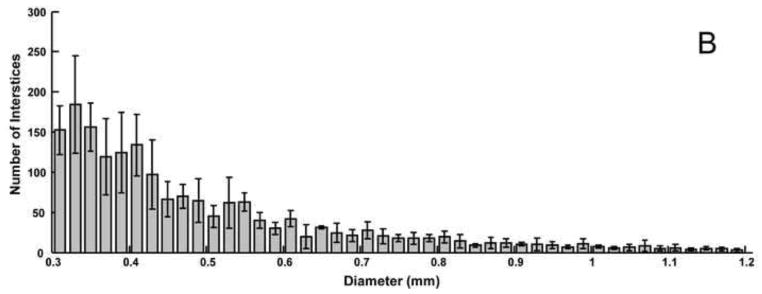
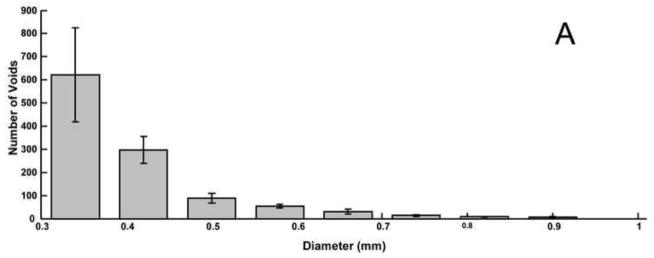
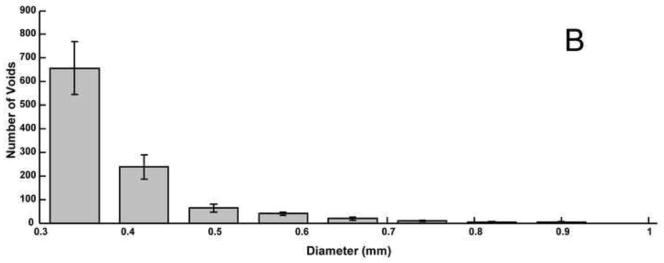
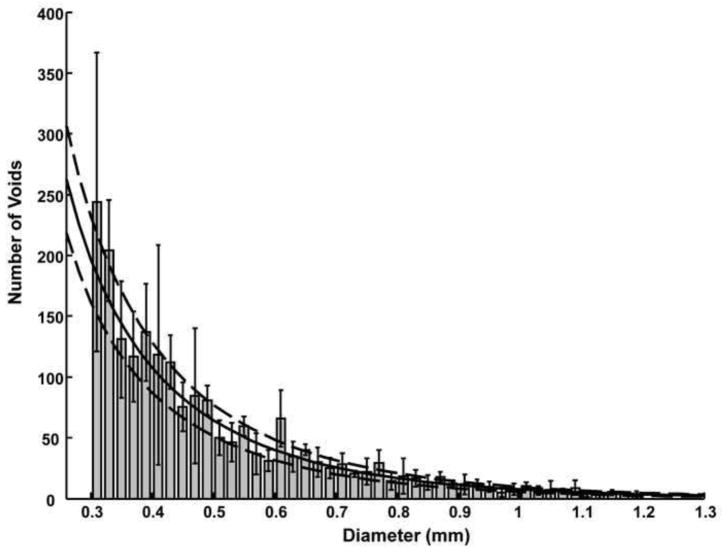
Methods: Eight identical aneurysms were packed with coils by both balloon- and stent-assist techniques. The samples were embedded, sequentially sectioned and imaged. Empty spaces between the coils were numerically filled with circles (2D) in the planar images and with spheres (3D) in the three-dimensional composite images. The 2D and 3D void size histograms were analyzed for local variations and by fitting theoretical probability distribution functions.
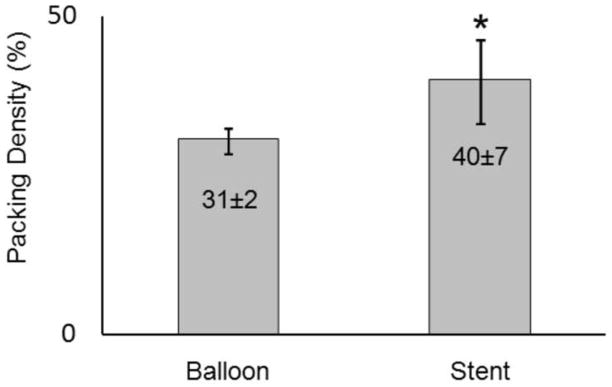
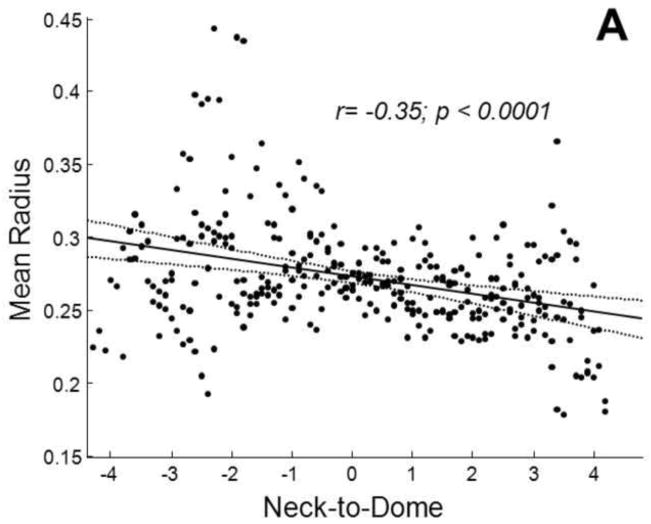
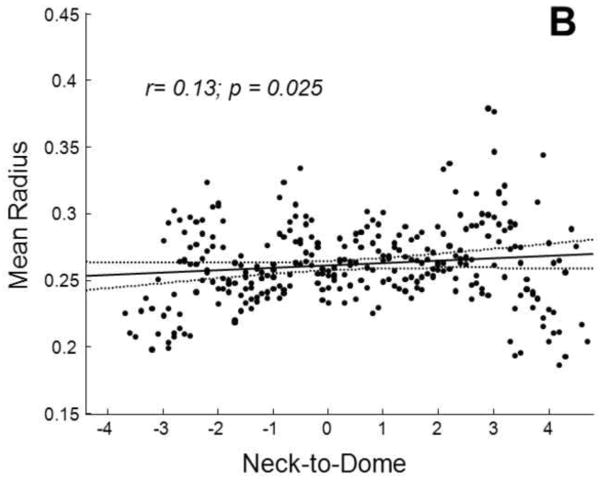
Results: Balloon-assist packing densities (31±2%) were lower (p=0.04) than the stent-assist group (40±7%). The maximum and average 2D and 3D void sizes were higher (p=0.03 to 0.05) in the balloon-assist group as compared to the stent-assist group. None of the void size histograms were normally distributed; theoretical probability distribution fits suggest that the histograms are most probably exponentially distributed with decay constants of 6-10 mm. Significant (p<=0.001 to p=0.03) spatial trends were noted with the void sizes but correlation coefficients were generally low (absolute r<=0.35).
Conclusion: The methodology we present can provide valuable input data for numerical calculations of hemodynamic forces impinging on intra-aneurysmal coil masses and be used to compare and optimize coil configurations as well as coiling techniques.
Keywords: Balloon; Exponential distribution; Histogram; Porous media; Silicone model; Stent.
Conflict of interest statement
No benefits in any form have been or will be received from a commercial party related directly or indirectly to the subject of this manuscript.
Figures
Similar articles
-
How do coil configuration and packing density influence intra-aneurysmal hemodynamics?AJNR Am J Neuroradiol. 2011 Nov-Dec;32(10):1935-41. doi: 10.3174/ajnr.A2635. Epub 2011 Sep 1. AJNR Am J Neuroradiol. 2011. PMID: 21885712 Free PMC article.
-
Numerical Investigation of Coil Configurations That Provide Ultra-High Packing Density of Saccular Aneurysms.J Med Device. 2009 Dec;3(4):41005. doi: 10.1115/1.4000453. J Med Device. 2009. PMID: 20354576 Free PMC article.
-
Evaluation of the stability of small ruptured aneurysms with a small neck after embolization with Guglielmi detachable coils: correlation between coil packing ratio and coil compaction.Neurosurgery. 2005 Apr;56(4):785-92; discussion 785-92. doi: 10.1227/01.neu.0000156790.28794.ea. Neurosurgery. 2005. PMID: 15792517
-
Impact of Coil Packing Density and Coiling Technique on Occlusion Rates for Aneurysms Treated with Stent-Assisted Coil Embolization.World Neurosurg. 2016 Oct;94:157-166. doi: 10.1016/j.wneu.2016.06.127. Epub 2016 Jul 9. World Neurosurg. 2016. PMID: 27402438
-
Finite element modeling of embolic coil deployment: multifactor characterization of treatment effects on cerebral aneurysm hemodynamics.J Biomech. 2013 Nov 15;46(16):2809-16. doi: 10.1016/j.jbiomech.2013.08.021. Epub 2013 Sep 18. J Biomech. 2013. PMID: 24119679
Cited by
-
Improving accuracy for finite element modeling of endovascular coiling of intracranial aneurysm.PLoS One. 2019 Dec 27;14(12):e0226421. doi: 10.1371/journal.pone.0226421. eCollection 2019. PLoS One. 2019. PMID: 31881029 Free PMC article.
-
Aneurysm permeability following coil embolization: packing density and coil distribution.J Neurointerv Surg. 2015 Sep;7(9):676-81. doi: 10.1136/neurintsurg-2014-011289. Epub 2014 Jul 16. J Neurointerv Surg. 2015. PMID: 25031179 Free PMC article.
References
-
- Linn FH, Rinkel GJ, Algra A, van Gijn J. Incidence of subarachnoid hemorrhage: role of region, year, and rate of computed tomography: a meta-analysis. Stroke; a journal of cerebral circulation. 1996;27(4):625–9. - PubMed
-
- Badjatia N, Carpenter A, Fernandez L, Schmidt JM, Mayer SA, Claassen J, et al. Relationship between C-reactive protein, systemic oxygen consumption, and delayed cerebral ischemia after aneurysmal subarachnoid hemorrhage. Stroke; a journal of cerebral circulation. 2011;42(9):2436–42. doi: 10.1161/STROKEAHA.111.614685. - DOI - PubMed
-
- van Gijn J, Rinkel GJ. Subarachnoid haemorrhage: diagnosis, causes and management. Brain : a journal of neurology. 2001;124(Pt 2):249–78. - PubMed
Grants and funding
LinkOut - more resources
Full Text Sources
