Review
. 2012 Jul;2(3):1619-70.
doi: 10.1002/cphy.c110016.

Computational models and emergent properties of respiratory neural networks

Affiliations
Review

Computational models and emergent properties of respiratory neural networks

Bruce G Lindsey et al. Compr Physiol. 2012 Jul.

Abstract

Computational models of the neural control system for breathing in mammals provide a theoretical and computational framework bringing together experimental data obtained from different animal preparations under various experimental conditions. Many of these models were developed in parallel and iteratively with experimental studies and provided predictions guiding new experiments. This data-driven modeling approach has advanced our understanding of respiratory network architecture and neural mechanisms underlying generation of the respiratory rhythm and pattern, including their functional reorganization under different physiological conditions. Models reviewed here vary in neurobiological details and computational complexity and span multiple spatiotemporal scales of respiratory control mechanisms. Recent models describe interacting populations of respiratory neurons spatially distributed within the Bötzinger and pre-Bötzinger complexes and rostral ventrolateral medulla that contain core circuits of the respiratory central pattern generator (CPG). Network interactions within these circuits along with intrinsic rhythmogenic properties of neurons form a hierarchy of multiple rhythm generation mechanisms. The functional expression of these mechanisms is controlled by input drives from other brainstem components,including the retrotrapezoid nucleus and pons, which regulate the dynamic behavior of the core circuitry. The emerging view is that the brainstem respiratory network has rhythmogenic capabilities at multiple levels of circuit organization. This allows flexible, state-dependent expression of different neural pattern-generation mechanisms under various physiological conditions,enabling a wide repertoire of respiratory behaviors. Some models consider control of the respiratory CPG by pulmonary feedback and network reconfiguration during defensive behaviors such as cough. Future directions in modeling of the respiratory CPG are considered.


Figures
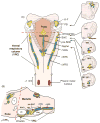
Figure 1
Figure 1
Overview of the mammalian brainstem illustrating major features of the anatomical distribution of pontine and medullary respiratory-related regions/compartments in dorsal (A, left), coronal (A, right), and parasagittal (B) planes. Dorsal view of brainstem in A with respiratory structures projected onto horizontal plane and the serial coronal sections at levels indicated show the dorsolateral pontine regions (K-F and PB) of the pontine respiratory group (PRG), and more caudally medullary regions of the ventral respiratory column (VRC) [retrotrapezoid nucleus (RTN)/parafacial respiratory group (pFRG), Bötzinger (BötC), pre-Bötzinger (pre-BötC), and rostral (rVRG) and caudal (cVRG) ventral respiratory groups]. Dorsomedial regions with the nucleus tractus solitarius (NTS), the caudal parts of which (cNTS) contain the DRG are indicated in A (left) and B, and the midline raphé nuclei are also shown. Distributions of respiratory premotoneurons (with direct connections to motoneurons, blue) and interneurons (with propriobulbar connections, yellow) are indicated. Locations of these neurons as depicted are highly schematic and provide only a general perspective of spatial distributions of some respiratory premotor and interneurons as determined from a variety of experimental approaches, including transsynaptic labeling with a viral tracer injected into the phrenic nerve. The spatial organization of respiratory microcircuits has not been determined in detail for any region, although general patterns of input and output axonal projections from various regions have been established in many cases. The VRC extends from the level of the rostral facial nucleus (VII) to caudally near the spino-medullary junction. The main clusters of rhythmically active VRC respiratory neurons are in the BötC, pre-BötC, rVRG, and cVRG. The RTN/pFRG at the rostral end of the VRC contains tonically active neurons with direct projections to the rest of the VRC and dorsolateral pons and also contains neurons with respiratory-modulated activity under some conditions, particularly at elevated levels of carbon dioxide (see text for full explanation). The raphé nuclei, with connections to the VRC as well as cranial and spinal motoneurons, also contain tonically active neurons, subsets of which can exhibit respiratory modulation. Dimensions indicated are typical for an adult rat. Other abbreviations: IO, inferior olivary nucleus; K-F, Kölliker-Fuse nucleus; V, trigeminal motor nucleus; NA, nucleus ambiguus; CNA, compact division of NA; PB, parabrachial nucleus; py, pyramidal tract; RO, raphé obscurus; scp, superior cerebellar peduncle; 7n, facial nerve. Dorsal and coronal views in A are modified, with permission, from reference (88) (Fig. 40.4, with permission from Academic Press).
Figure 2
Figure 2
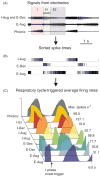
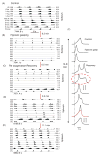
Spiking patterns of ventral respiratory column (VRC) respiratory neurons. (A) Illustration of representative signals recorded simultaneously from three types of neurons with an extracellular recording electrode array and efferent phrenic nerve activity (data from a decerebrate cat). Color shaded overlays indicate the three “phases” of the respiratory cycle (see text). (B) Times of occurrence of individual spikes extracted from top traces by spike sorting. Adapted, with permission, from reference (297) (Fig. 1). (C) Average firing rates of eight simultaneously monitored VRC neurons and phrenic nerve activity. Temporal patterns of neuron spiking are represented by respiratory cycle-triggered spike frequency histograms obtained by triggering histogram computation at the onset of phrenic nerve activity signal (labeled arrow). Data are from a different animal than top traces. Adapted, with permission, from reference (222) (Fig. 1).
Figure 3
Figure 3
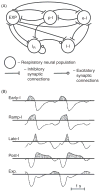
An early respiratory network model proposed to generate a three-phase pattern of neural activity. (A) Model schematics indicating excitatory and inhibitory synaptic interactions among respiratory neuron populations including expiratory (EXP), postinspiratory (post-I), early-inspiratory (e-I), late-inspiratory (l-I), and ramp-inspiratory (IR) populations. Note that IR represents an excitatory and inhibitory population lumped in the schematic as a single component for simplicity. Not shown are excitatory inputs to each component from the reticular activating system that are reduced when p-I cells fire. (B) Patterns of activity for the model components (two cycles are shown). For each component, the period of active firing is indicated by the stippled region above threshold (horizontal line). Adapted, with permission, from reference (224) (Figures 3 and 4).
Figure 4
Figure 4
Intrinsic electrophysiological behavior of inspiratory bursting “pacemaker” neurons that represent the cellular basis for pre-Bötzinger (pre-BötC) excitatory pacemaker-network models incorporating INaP-dependent bursting properties. (A, B) Example of voltage-dependent activity states (silence, oscillatory bursting, and tonic spiking) (A) and temporal features of bursting (B) of a pre-BötC inspiratory neuron recorded after blocking synaptic inputs in vitro, with corresponding bursting features (C) in the pacemaker neuron model (model 1) developed by Butera et al. (29). This H-H style conductance-based, biophysically minimal model incorporates INaP as the main subthreshold voltage-activating, burst generating inward current, with voltage-dependent slow inactivation, represented in the model by the kinetics of the inactivation parameter h. The pre-BötC neuron transitions from silence to oscillatory bursting and then tonic spiking as the baseline membrane voltage is depolarized by constant applied current—conditional bursting behavior also exhibited by the model (29). In the oscillatory bursting regime, in both the model and data, bursting frequency increases (see A and D) and burst durations decrease (see B and C) with steady depolarizing shifts of baseline potential. (B, C) Neuronal spiking profiles during individual bursts at two different voltage levels in the neuron model simulations (B) and from the example recordings (individual bursts from A indicated by *1 and *2 are shown in panel C with an expanded time scale), illustrating the declining spiking frequency (f) during the burst as shown in spike frequency histograms; histograms illustrated in C from recordings are averaged over multiple bursts. This spiking profile results from progressive inactivation of INaP, indicated by the time course of the inactivation parameter h during the burst phase (B), which causes burst termination followed by a slow recovery from inactivation that controls the period of the interburst interval and thus timing of the next burst (for full descriptions of the kinetics of the bursting cycle including dynamic interactions of INaP and the K+-dominated leak current in the model see references (29, 30). (D) The model reproduces the monotonic increase in bursting frequency over a wide dynamic range as baseline membrane voltage is depolarized. This voltage-dependent control of bursting frequency is reflected in the control of neuronal population bursting frequency by tonic excitatory inputs in models of pre-BötC heterogeneous excitatory networks incorporating subpopulations of INaP-dependent bursters (see Fig. 5). Adapted, with permission, from reference (30) (Fig. 12.1, with permission, from World Scientific Press).
Figure 5
Figure 5
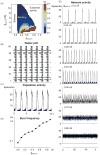
Generation of oscillations in model excitatory networks incorporating neurons with intrinsic bursting properties. (A) Behavior of a small (two-cell) network illustrating effects of a mean level of tonic excitatory input, represented by the conductance gtonic-e, and excitatory synaptic conductance gsyn-e on the dynamics of bursting and sustained spiking activity of pairs of identical coupled Butera et al. (29) model 1 neurons. Each neuron incorporates the persistent (slowly inactivating) Na+ current (INaP), a K+-dominated leak current, and spike-generating transient Na+, and delayed rectifier K+ currents representing a biophysically minimal set of ionic conductances. The model neurons are mutually coupled in an excitatory network by modeled glutamatergic-like synapses (non-NMDA (N-Methyl-D-aspartate) receptor mediated) with synaptic dynamics generating fast postsynaptic responses with conductance gsyn-e as described in detail in reference (29). The plot represents burst frequency; colored areas indicate frequencies for the gtonic-egsyn-e parameter sets producing oscillatory bursting. Range of burst frequencies is indicated by the color bar on the right. Parameter sets to the left or right of the oscillatory bursting region result, respectively, in no activity (silence) or sustained spiking activity. (B, C) Synchronized activity of a heterogeneous population of 50 bursting model 1 neurons represented as a raster plot (B) of spike times across the population and histogram of population spiking activity (bin size = 10 ms) (C). Neurons are coupled (all-to-all) by the fast glutamatergic-like excitatory synapses with gsyn-e. Heterogeneity, due to a distribution of leak currents within the model population, results in a temporal dispersion of spiking onset times in the population including cells generating preinspiratory/inspiratory (pre-I/I) spiking activity as seen in the raster plot. As a result of heterogeneity of cellular properties in the network, only a fraction of the neurons in the population exhibit intrinsic pacemaker-like rhythmic bursting activity when synaptically uncoupled. Single neuron spiking behavior and population oscillations generated by the intact network have temporal patterns (C) similar to those recorded from the neonatal rodent pre-Bötzinger (pre-BötC) network isolated in medullary slices in vitro. (D) Network burst frequency for a model 50-cell network as a function of gtonic-e. (E) Histograms of network spiking activity (10-ms bin size) as the mean level of gtonic-e is increased. Elevation of this input (from top to bottom) increases burst frequency and, finally, switches the population activity from rhythmic bursting to sustained asynchronous activity. Adapted, with permission, from reference (28) (Figures 3B1, 3B2, 2C, 7B, and 7A1–7A7).
Figure 6
Figure 6
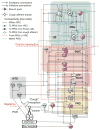
The hybrid pacemaker-network model. Core circuits of the respiratory CPG network in this conductance-based neuronal model consist of interacting populations of different medullary excitatory and inhibitory interneurons and incorporate the excitatory pacemaker-network “kernel,” representing the pre-Bötzinger (pre-BötC) network composed of a heterogeneous population of inspiratory neurons [excitatory preinspiratory/inspiratory (pre-I/I) and early-inspiratory (early-I types)] with INaP (their activity from model simulations is shown at the top left). Subsets of these excitatory neurons had Butera et al. model 1-type, conditional oscillatory bursting properties when synaptic interactions are eliminated. Excitatory interneurons (see examples of activity patterns at right) in premotor pattern formation circuits driven by the pre-BötC network generate excitatory synaptic drive in parallel transmission pathways to cranial and spinal (pre)motor neurons. Interconnected inhibitory interneurons [e.g., postinpiratory (post-I), second expiratory (E2), augmenting E neuron (aug-E), and early-I types with reciprocal connections, as well as late-inspiratory (late-I) spiking neurons, middle bottom] generate temporal patterns of synaptic inhibition that dynamically control activity of the pre-BötC network via feedback connections from the late-I, post-I, and E2 populations (only a few connections are shown for simplicity). Inhibitory interneurons also provide feed-forward inhibition projecting to the excitatory drive transmission populations (connections from post-I, E2, and early-I neurons are shown) to sculpt premotor output activity to form a three-phase activity pattern with preinspiratory/inspiratory (pre-I/I), early-I, ramp-inspiratory (ramp-I), post-I, and E2 spiking patterns. This activity mirrors the three-phase activity pattern of the interacting excitatory kernel and inhibitory interneurons. This model incorporated the concept of the excitatory kernel network with state-dependent intrinsic oscillatory bursting properties in the pre-BötC and their dynamic regulation by inhibitory expiratory neuron populations giving rise to multiple possible modes of rhythm generation. The model also represents the various types of medullary respiratory interneurons as consisting in most cases of both inhibitory and excitatory neurons. Modified, with permission, from reference (312) (Fig. 3, with permission, from Elsevier).
Figure 7
Figure 7
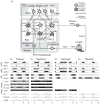
A ponto-medullary model of the respiratory CPG developed by Rybak et al. (285) that incorporates compartmentalized network components and regulation of medullary network activity by pontine inputs as well as feedback signals via peripheral respiratory system, lung-related afferent inputs conveyed by the vagus nerve. (A) Model schematic. Each sphere represents a population of 50 neurons incorporating various membrane conductances. Dashed lines with arrows represent excitatory synaptic connections and solid lines ending with small circles show inhibitory connections. Additional arrows at the population circles indicate external excitatory tonic drive to each population. Simulations in B-E illustrate model performance under different conditions. The top six traces show membrane potential trajectories of a randomly selected neuron from each population, and the next four traces show respiratory modulated (mod) or tonic spiking patterns of pontine populations; the three bottom traces show simulated integrated hypoglossal (XII) and phrenic nerve activities and lung volume excursions (the bottom trace), which provide afferent mechanosensory input signals for control of respiratory phase durations and activity patterns. (B) Performance of the intact network (eupnea). (C) “Vagotomy”: vagal feedback in the model is disconnected. (D) “Apneusis” produced by removal of inputs from rPons (E-mod, IE-mod, and I-mod). (E) Complete removal of the pons switches the system to the state in which the rhythm in the network is completely driven by INaP-dependent bursting pacemaker activity originating in the pre-Bötzinger complex (pre-BötC). Adapted, with permission, from reference (285) (Figures 1, 2A, B, and 5, with permission, from Elsevier).
Figure 8
Figure 8
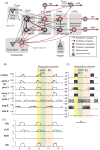
Schematic of the brainstem respiratory network model incorporating connections inferred from in vivo multielectrode array recordings in decerebrate cats (297). Each large-labeled circle represents a distinct neuron population using nomenclature conventions summarized in Table 1. Intra- and interregional connections are indicated by color-coded lines; dots mark branch points of divergent projections. Model parameters for cell properties and the connections among the populations are detailed in Tables 6 and 7 of Appendix in reference (279). Red dashed lines label specific simulated perturbations. Adapted, with permission, from reference (279) (Fig. 4).
Figure 9
Figure 9
Performance of the large-scale brainstem respiratory network model as shown schematically in Figure 8 under different conditions. The top traces (except the bottom trace for phrenic activity) show simulations, based on integrate-and-fire (IF) cellular models, of membrane potential trajectories of one, randomly selected neuron from the major neural populations represented in the model. Note that the labels for the inspiratory decrementing (I-DEC) and expiratory decrementing (E-DEC) neuron membrane potential traces refer to the decrementing rate of spike generation in each cycle due to an elevation of threshold in the IF style neurons not reflected in the membrane potential trace. (A) Performance of the intact network (eupnea). (B) “Vagotomy”—vagal feedback in the model is disconnected (indicated by a blue vertical dashed line). (C) Gasp-like pattern originating in the pre-Bötzinger (pre-BötC) population with INaP-dependent bursting behavior after pontine transection (pons removed). (D) Model prediction of coexpression of gasp-like burst and eupneic-like ramp pattern of phrenic nerve activity with progressive increase of tonic excitation of ventral respiratory column (VRC) populations. A “burst-ramp” type phrenic motor pattern emerged with the onset of tonic reexcitation of the VRC network populations (red dashed line). (E) Expanded time scale trace from D shows a burst-ramp type pattern during an inspiratory phase. (F) Summary of a prediction from the model showing that two active rhythmic burst pattern generating processes (inhibitory network-based and INaP-dependent excitatory pacemaker-network-based mechanisms) can be simultaneously expressed during recovery from hypoxic gasping. See text for details. Adapted, with permission, from reference (279) (Figures 5 and 10).
Figure 10
Figure 10
In vivo ventral respiratory column (VRC) neuronal activity profiles during control conditions, hypoxic gasping, and recovery. (A–E) Firing rates of ten simultaneously recorded VRC inspiratory/expiratory neurons and phrenic nerve activity from decerebrate cat during the prehypoxia control period (A), hypoxia-induced gasp-like activity (B), and reoxygenation (C–E). (F) Integrated phrenic nerve activity profiles detail control, gasping, and a return to eupneic-like (ramping) phrenic activity patterns with superimposed augmented bursts. Pattern with dashed line ellipse is similar to the phrenic activity profile observed in model simulations as shown in Figure 9. This pattern occurs during successive cycles and occasionally alternates (bidirectional arrows) with the gasp-like phrenic burst pattern. See text for details. Adapted, with permission, from reference (279) (Fig. 11).
Figure 11
Figure 11
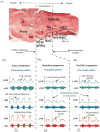
Transformations of respiratory rhythm and motor pattern following sequential brainstem transection in the in situ arterially perfused brainstem-spinal cord preparation from juvenile rat, revealing three rhythmic states of the respiratory network as the circuitry is progressively reduced. (A) Parasagittal section (neutral red stain) of the brainstem at the level of the ventral respiratory column (VRC), and lateral pons (5, trigeminal nucleus; 7, retrotrapezoid nucleus (RTN); 7n, facial nerve; BötC, Bötzinger complex; cVRG, caudal ventral respiratory group (VRG); NA, nucleus ambiguous; pre-BötC, pre-Bötzinger complex; rVRG, rostral VRG; RTN/pFRG, retrotrapezoid nucleus/parafacial respiratory group; s.p., superior cerebellar peduncle; SO, superior olive; VRC, ventrolateral respiratory column). (B1–B3) Representative activity patterns of phrenic (PN), hypoglossal (HN), and central vagus (cVN) nerves recorded from the intact preparation (B1), “medullary preparation” obtained by transections at the pontine-medullary junction performed to remove the pons (vertical dot-dashed line, middle panel) (B2), and “pre-BötC preparation” obtained by transections at the rostral boundary of the pre-BötC made to remove all compartments (RTN/pFRG, BötC) rostral to pre-BötC (vertical dot-dashed line, right panel). Each panel shows raw (bottom traces) and integrated (upper traces) recordings of motor nerve discharge. Vertical dashed lines in B1 indicate onsets of HN inspiratory burst. Dashed lines in B2 and B3 indicate synchronous onset of inspiratory bursts in all nerves characteristic of the two-phase and one-phase rhythmic patterns. Motor nerve discharges have square-wave and decrementing shapes in the two-phase and one-phase patterns, respectively, which characterize these two different rhythmic states. Adapted, with permission, from reference (311) (Fig. 2).
Figure 12
Figure 12
Role of the persistent sodium current (INaP) in rhythm generation in different network states. (A1–A3) Steady-state dose-dependent effects of INaP blocker, riluzole, on burst frequency (solid lines) and amplitude (dashed lines) of integrated phrenic nerve (PN) activity recorded in the intact (A1), medullary (A2), and pre-BötC (A3) preparations with motor patterns shown in Figure 11. PN discharge amplitudes and frequency are normalized (% control). Burst frequency does not change significantly in the intact preparation (A1), but is reduced to a constant value in medullary preparations (A2). In pre-BötC preparations (A3), PN burst frequency is reduced monotonically with increasing riluzole concentration, and rhythmogenesis is abolished at drug concentrations 10 μmol/L or more. All values represent means ±SD (error bars). *Statistical significance (P < 0.05). (B1–B3) Effects of reducing INaP on frequency and amplitude of motor output (PN) in the intact (B1), medullary (B2), and pre-BötC (B3) network models (refer to Figure 11). Attenuation of INaP is modeled by uniformly reducing the maximum conductance for the persistent sodium channels (NaP ) in all neurons of the pre-I/I population in the pre-BötC network. Effects of reducing NaP on frequency (solid lines) and amplitude (dashed lines) of simulated PN bursts (% control) closely reproduce experimental data shown in A1–A3, including the initial decrease in burst frequency in the medullary preparation (B2, cf. with A2), and the decrease in burst frequency with decreasing NaP with termination of rhythm generation (at NaP = 2.5 nS) in the case of the one-phase rhythmic state (B3, cf. with A3). Reduction of burst amplitudes (dashed lines) is also consistent with experimental data, although perturbations in model are smaller than those observed experimentally. Adapted, with permission, from reference (310) (Figures 6A and 9).
Figure 13
Figure 13
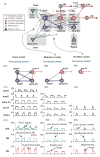
Computational model of the brainstem respiratory network by Smith et al. (310). (A) Schematic of the model network showing interactions between different populations of respiratory neurons within major brainstem compartments involved in the control of breathing [Bötzinger (BötC), pre-Bötzinger (pre-BötC), and rostral (rVRG) and caudal (cVRG) ventral respiratory groups). Each population consists of 50 single-compartment neurons incorporating H-H style conductances with heterogeneous distributions of parameters within the population. Green triangles represent sources of tonic excitatory drives (from pons, RTN/pFRG, and raphé nuclei) to different neural populations (only several drives are shown connected). Simulated “transections” (dot-dashed lines) mimic those performed in situ as shown in Figure 11. (B1–B3) Key elements and circuits within the intact (B1), medullary (B2), and pre-BötC (B3) models involved in rhythmogenesis (excitatory drives are not shown). The three-phase pattern is generated by a core circuit with a three-population mutual inhibitory ring-like architecture interacting with the preinspiratory (pre-I/I) pre-BötC excitatory kernel network. A reduced network configuration lacking the BötC postinspiratory (post-I) inhibitory population generates the two-phase inspiratory-expiratory rhythmic pattern, which is dependent on mutual inhibitory interactions of the active augmenting E neurons (aug-E) and early inspiratory (early-I) (type 1) populations in a “half-center”-like circuit that interacts with the pre-I/I population. The one-phase pattern is generated by INaP-dependent rhythmic bursting activity of the pre-I/I excitatory population in pre-BötC that synaptically drives the downstream HN and excitatory rVRG populations for inspiratory (pre)motor output generation. (C1–C3) Simulations of activity of selected neuronal populations in the model. Activity of each population is represented by a histogram of the average neuronal spiking frequency within the population (spikes/s/neuron, bin size = 30 ms). (D1–D3) Simulated motor outputs (cVN, HN, and PN) in each model. Adapted, with permission, from reference (310) (Figures 7 and 8).
Figure 14
Figure 14
An activity-based model of the four-population core of the brainstem respiratory network generating the three-phase respiratory pattern. (A) Model schematic of the BötC-pre-BötC network with preinspiratory (pre-I/I), early-inspiratory (early-I), postinspiratory (post-I), and augmenting-inspiratory (aug-E) neuron types. Spheres represent neurons (excitatory: red; inhibitory: blue); green triangles represent three sources of tonic excitatory drives [from pons, retrotrapezoid nucleus (RTN), and raphé] to different neural populations, each modeled as a single element described mathematically by activity functions f(V). (B) Model performance. Traces of simulated model output activities for all four neurons (f1(V1), f(V2)f(V4)). (C, D) Control of oscillation period and phase durations by excitatory drive. Changes of the oscillation period (T) and durations of inspiration (TI) and expiration (TE) were produced by changes in the total (net) drive to the preinspiratory (pre-I/I) neuron (D1, C) and to the augmenting expiratory (aug-E) (D4, D) neuron. Adapted, with permission, from reference (276) (Figures 1B, 2A, 3A, and D).
Figure 15
Figure 15
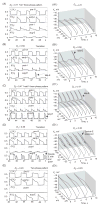
Transition from the “bio” three-phase pattern to the two-phase pattern with progressive reduction of drive to the postinspiratory (post-I) neuron (D3) in the activity-based model of Rubin et al. (273). Traces in A–E (left) show output activities of all four neurons (f1(V1), f(V2)f(V4)). (A1–A4) show corresponding dynamic trajectories of preinspiratory (pre-I/I) versus augmenting E (aug-E) neuron voltages (V1 vs. V4) over successive cycles illustrating the emergence of additional aug-E activity patterns in transitional regimes between the three-phase and two-phase patterns when D3 is reduced from top to bottom (from A, A1 to E, E1), as indicated in the diagram labels. Panels A and A1 correspond to the initial “bio” three-phase pattern. Note the emergence of late-E bursts in aug-E neuron in panels B, B1 and C, C1. Diagrams C, C1 represent the “math” three-phase oscillations. Diagrams D, D1 show an example of the double burst, biphasic-E activity pattern in the aug-E neuron. Finally, diagrams E, E1 illustrate two-phase oscillations. Adapted, with permission, from reference (276) (Fig. 11 A–E).
Figure 16
Figure 16
Experimental data illustrating quantal acceleration of late-expiratory (late-E) abdominal activity with the development of hypercapnia (increase in the CO2 concentration in the perfusate of an arterially perfused in situ juvenile rat brainstem-spinal cord preparation). (A1–A4) Simultaneously recorded activity of (bottom-up) phrenic (PN, red), abdominal (AbN, black), cervical vagus (cVN, green), and hypoglossal (HN, blue) nerves. Activity of each nerve is represented by two traces: raw recording (lower trace) and integrated activity (upper trace). (A1) Normocapnia (5% CO2): late-E activity is absent in the AbN. (A2–A4) Quantal acceleration of AbN activity: with the development of hypercapnia, the ratio between the AbN and PN frequencies goes through step-wise changes from 1:3 and 1:2 (A2 and A3, 7% CO2) to 1:1 (A4, 10% CO2). (B) Time-series representation of the entire experimental epoch with the oscillation periods in the PN (red squares) and AbN (black circles) plotted continuously. The AbN late-E bursts were synchronized with the PN bursts with a ratio increasing quantally from 1:5 to 1:1. The content of CO2 in the perfusate of this preparation was changed at times indicated by short arrows and vertical dashed lines. Large arrows indicate times corresponding to the episodes shown in A1–A4. Adapted, with permission, from reference (200) (Fig. 1).
Figure 17
Figure 17
The extended model of the brainstem respiratory network by Molkov et al. (200). (A) Schematic of the model showing interactions between different populations of respiratory neurons within major brainstem compartments [pons, retrotrapezoid nucleus (RTN)/parafacial respiratory group (pFRG), Bötzinger (BötC), pre-Bötzinger (pre-BötC), and rostral (rVRG) and caudal (cVRG) ventral respiratory groups). Each population (shown as a sphere) consists of 50 single-compartment neurons described in the H-H style. In comparison with the previous model (310), see Figure 13A, this model additionally incorporates the population of bulbospinal premotor expiratory (E) neurons in cVRG, representing the source of AbN activity, and the late-E population in the RTN/pFRG compartment, serving as a source of INaP-dependent oscillations in RTN/pFRG. The model includes three sources of tonic excitatory drive: pons, RTN and raphé shown as green triangles. These drives, especially those from the pontine and RTN sources project to multiple neural populations in the model (green arrows, only the most important connections are shown to particular populations). The late-E population receives an additional external drive simulating the effect of hypercapnia; the pontine drive is considered to be hypoxia/anoxia dependent and was reduced in simulations of hypoxic conditions [see examples in Molkov et al. (200)]. (B) Model performance under normal conditions. The activities of major neural populations in the model are represented by average histograms of activity of all neurons in each population (spikes/s/neuron, bin size = 30 ms). The populations shown include (top-down): ramp-inspiratory (ramp-I located in rVRG), early-inspiratory [early-I(2) in rVRG], preinspiratory/inspiratory (pre-I/I in pre-BötC), early-inspiratory [early-I(1) in pre-BötC], postinspiratory (post-I in BötC), augmenting expiratory (aug-E in BötC), and late-expiratory (late-E in RTN/pFRG). The latter population is silent under normal conditions. (C) Traces of membrane potentials of the corresponding single neurons (randomly selected from each population). (D) The model’s motor outputs: hypoglossal (HN, blue); cervical vagus (cVN, green); abdominal (AbN, black, silent under normal conditions); phrenic (PN; red). In B–D, the three phases of respiratory cycle are highlighted: I (yellow), post-I (light green), second expiratory (E2, pink). It is seen that pre-I/I neurons and HN start firing in advance of the beginning of inspiration defined by the onset of PN (and the ramp-I population) activity. Adapted, with permission, from reference (200) (Fig. 7).
Figure 18
Figure 18
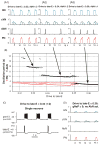
Modeling the effects of progressive hypercapnia and INaP blockade in the extended model of Molkov et al. (200). (A1–A3) The activity of motor outputs in the model during simulated hypercapnia. The late-E bursts in the abdominal nerve motor output (AbN) were always phase-locked with phrenic (PN) bursts and the ratio between AbN and PN burst frequencies quantally increased through 1:3 (A1) to 1:2 (A2) and to 1:1 (A3) regimes as “hypercapnic” drive to the late-E population of RTN/pFRG was gradually increased to simulate progressive hypercapnia. (B) The dependence of oscillation periods in AbN (black circles) and PN (red squares) activities on the hypercapnic drive (horizontal axis). This simulation shows a quantal acceleration of AbN activity during a gradual increase in the simulated hypercapnic drive. The ratio between AbN and PN burst frequencies sequentially jumped from 1:4 to 1:3 (as in A1), then to 1:2 (as in A2), and finally to 1:1 (as in A3). See Figure 15 for comparison to experimental data. With quantal acceleration of AbN activity (after it emerges at a simulated drive level of 0.31 and before it reaches the 1:1 ratio at 0.35). Branches of red lines (bottom) represent alternating values of PN burst period depending on the presence or absence of an AbN burst during the corresponding cycle. (C) Membrane potential traces of single neurons from the preinspiratory/inspiratory (pre-I/I) population of pre-Bötzinger (pre-BötC) (upper trace) and the late expiratory (late-E) population of retrotrapezoid nucleus (RTN)/parafacial respiratory group (pFRG) (bottom trace) corresponding to the regime of 1:2 coupling between AbN and PN bursts (A2). (D) Simulation of the effect of INaP blockade. Model output motor activities illustrated correspond to the 1:1 coupling regime shown in A3. The blockade of INaP was simulated by setting its maximal conductance to zero in all pre-I/I and late-E neurons of the model, which eliminated AbN activity and reduced the amplitude and frequency of other simulated motor outputs (compare with A3). Adapted, with permission, from reference (200) (Fig. 8).
Figure 19
Figure 19
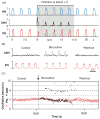
Release of the abdominal nerve motor output (AbN) late-expiratory (late-E) bursting under normal conditions by suppressing inhibition in retrotrapezoid nucleus (RTN)/parafacial respiratory group (pFRG). (A) Simulation results from the Molkov et al. (200) model. The traces of motor outputs [PN, AbN, and hypoglossal motor output (HN)] generated by the model are shown. Drive to the late-E population was set to 0.3, below the threshold for late-E population activation (see Fig. 18B). To simulate the blockade of inhibition within RTN/pFRG, the weights of inhibitory synapses in late-E neurons were set to zero during the time interval between 10 and 17.5 s (indicated by gray area). Removing inhibition evoked late-E oscillations in both the late-E population in the RTN/pFRG (not shown) and in the model’s AbN output. The bursts generated were phase-locked to PN oscillations. After inhibition returned to the previous level (at 17.5 s) AbN activity disappears. (B, C) Experimental testing of the earlier described modeling prediction. The experiment shown was performed at normal metabolic conditions with 5% CO2 in the perfusate of an arterially perfused juvenile rat brainstem-spinal cord preparation. Under control conditions there was no late-E bursting activity in AbN (see AbN activity in B, left column, and a lack of black circles in C under “control”). Bicuculline (10 μmol/L), a blocker of GABAA receptor-mediated synaptic inhibition, was bilaterally microinjected in the ventrolateral (vl) RTN)/pFRG at the time point shown in C by the vertical dashed line. As seen in B (middle column) and C (black circles), the application of bicuculline evoked rhythmic late-E activity in AbN phase-locked with PN bursts. The AbN activity evoked by disinhibition then disappeared with drug washout (see right column in B and lack of black circles in C, right part). Adapted, with permission, from reference (200) (Fig. 12).
Figure 20
Figure 20
Proposed interactions between Bötzinger-pre-Bötzinger (BötC-pre-BötC) and retrotrapezoid nucleus (RTN)/parafacial respiratory group (pFRG) oscillators in juvenile/adult mammals in vivo based on experimental observations and model simulations. Red arrows represent excitatory influence; blue lines terminated with circles indicate inhibitory influence; violet arrows indicate metabolic dependence. Under normal metabolic conditions, the RTN/pFRG oscillator is inhibited by the BötC-pre-BötC core circuit oscillator during both inspiration [by the inhibitory early-inspiratory (early-I) neurons of pre-BötC] and expiration [by the post-inspiratory (post-I) neurons of BötC] and remains quiescent. The normal expression of post-I inhibition requires excitatory drive from the pons (not shown). The RTN/pFRG oscillator can be activated either by hypercapnia, which directly excites RTN/pFRG neurons, or by hypoxia/anoxia (or suppression of pontine activity), which reduces RTN/pFRG inhibition by the BötC-pre-BötC oscillator, or by both of the above metabolic conditions. When activated, the RTN/pFRG oscillator provides excitation of the BötC-pre-BötC oscillator and transient inhibition of rVRG premotor neurons, hence increasing the delay between hypoglossal and phrenic motor discharges. Adapted, with permission, from reference (200) (Fig. 13).
Figure 21
Figure 21
Conceptual and computational model circuits for producing respiratory modulated firing in nonrespiratory modulated (NRM) tonic neurons due to increased I-Aug neuron activity following simulated loss of pulmonary stretch receptor (PSR) feedback as would occur during withholding of lung inflation or after vagotomy. (A) Schematic of the conceptual model for increased inspiratory modulation of pontine respiratory group (PRG) neurons with vagotomy via loss of inhibitory “gating” of ventral respiratory column (VRC) inspiratory-augmenting (I-Aug) neuron excitation. (B) Schematic representation of the change in modulation of some PRG and raphé neurons observed after vagotomy. (C) Schematic of an alternative feed-forward inhibitory circuit module embedded in a larger respiratory network model with PSR inputs similar to the network model shown in Figure 8. The VRC I-Aug neurons drive, via an efferent copy mechanism (e.g., collateral axons), a population of tonic neurons and a less excitable phasically active population (Inh) that inhibits the tonic neurons. Under control conditions, the tonic population includes neurons without respiratory modulated activity because of the balanced effects of synaptic inputs from the I-Aug and Inh populations. (D) Nonrespiratory modulated tonic neurons are “converted” to a respiratory modulated pattern following simulated vagotomy because of increased I-Aug population activity and the excitability properties of the Inh population. Representative traces of firing behavior of individual cells from the three integrate-and-fire neuron populations represented in C, before (left) and after (right) elimination of pulmonary stretch receptor feedback. Note the lack of respiratory modulation of the tonic neuron (NRM) before vagotomy. (E) Spike frequency histograms of model and electrophysiologically recorded tonic neuron comparing spiking patterns before and after vagotomy. Gray traces show corresponding phrenic activity to define the inspiratory phase. Circuit module simulation parameters were as described in Dick et al. (60). Adapted, with permission, from Dick et al. (60) [Fig 10 and (208), Fig 7].
Figure 21
Figure 21
Conceptual and computational model circuits for producing respiratory modulated firing in nonrespiratory modulated (NRM) tonic neurons due to increased I-Aug neuron activity following simulated loss of pulmonary stretch receptor (PSR) feedback as would occur during withholding of lung inflation or after vagotomy. (A) Schematic of the conceptual model for increased inspiratory modulation of pontine respiratory group (PRG) neurons with vagotomy via loss of inhibitory “gating” of ventral respiratory column (VRC) inspiratory-augmenting (I-Aug) neuron excitation. (B) Schematic representation of the change in modulation of some PRG and raphé neurons observed after vagotomy. (C) Schematic of an alternative feed-forward inhibitory circuit module embedded in a larger respiratory network model with PSR inputs similar to the network model shown in Figure 8. The VRC I-Aug neurons drive, via an efferent copy mechanism (e.g., collateral axons), a population of tonic neurons and a less excitable phasically active population (Inh) that inhibits the tonic neurons. Under control conditions, the tonic population includes neurons without respiratory modulated activity because of the balanced effects of synaptic inputs from the I-Aug and Inh populations. (D) Nonrespiratory modulated tonic neurons are “converted” to a respiratory modulated pattern following simulated vagotomy because of increased I-Aug population activity and the excitability properties of the Inh population. Representative traces of firing behavior of individual cells from the three integrate-and-fire neuron populations represented in C, before (left) and after (right) elimination of pulmonary stretch receptor feedback. Note the lack of respiratory modulation of the tonic neuron (NRM) before vagotomy. (E) Spike frequency histograms of model and electrophysiologically recorded tonic neuron comparing spiking patterns before and after vagotomy. Gray traces show corresponding phrenic activity to define the inspiratory phase. Circuit module simulation parameters were as described in Dick et al. (60). Adapted, with permission, from Dick et al. (60) [Fig 10 and (208), Fig 7].
Figure 22
Figure 22
Schematic of a raphé-ventral respiratory column (VRC) circuit model proposed to contribute to baroreceptor modulation of breathing, and changes in the integrated neuronal discharge patterns from the model with simulated baroreceptor stimulation. (A) Each neuron population is represented by a large circle labeled to indicate the corresponding respiratory modulation (see Table 1 for VRC nomenclature; other abbreviations for raphé neurons: RM, rostral midline; CM, caudal midline). Arrows indicate firing rate response to elevated arterial blood pressure in raphé, expiratory-decrementing (E-Dec) and inspiratory premotor and phrenic motor neuron (I-Aug) populations. Circuit connections were inferred from cross-correlation analysis of simultaneous multineuronal recordings in the anesthetized cat. Adapted, with permission, from reference (162) (Fig. 12). (B) The raphé circuits and connections with the VRC were incorporated into the enhanced ponto-medullary network model consisting of integrate-and-fire neurons as defined in reference (279) to perform simulations. Integrated population activity traces (simulated excitatory raphé population and four VRC populations, including I-Aug neurons as a surrogate for phrenic motor neurons represented in Panel A) from before and after (red vertical dashed line) baroreceptor afferent fiber population-mediated perturbation of the raphé populations (n = 100 neurons each). Note the reduced integrated phrenic discharge amplitude (blue dashed line) and prolonged expiratory duration. The short green and red arrows highlight the effects of the reciprocal connectivity between the excitatory RM raphé population and the inhibitory E-Dec-Tonic population following stimulus onset. Raphé-to-E-Dec and raphé-to-E-Dec-Tonic population connections were mediated by 100 synaptic terminals; both excitatory [0.2 synaptic strength (ss)] and inhibitory (0.01 ss) synapses had a 5-ms time constant (tau). The E-Dec-Tonic-to-raphé connections were also via 100 synaptic terminals (0.001 ss, 1.5 ms tau), as were the E-Dec-Tonic-to-I-Aug interactions (0.05 ss, 1.5 ms tau). Adapted, with permission, from reference (166) and unpublished results.
Figure 23
Figure 23
Model simulations of cough. Activity profiles of ponto-medullary and motor neuron populations during eupnea-like and cough motor patterns from the ponto-medullary network model detailed in Rybak et al. (279). Transformations during simulated cough of the model’s eupneic activity patterns of pontine neurons, ventral respiratory column (VRC) inspiratory/expiratory neurons, and respiratory motor outputs (laryngeal, phrenic, and lumbar) are highlighted with expanded time scale traces at right. Adapted, with permission, from reference (279) (Fig. 7).
Figure 24
Figure 24
Integrated model of brainstem respiratory controller and peripheral gas exchange and transport. This model incorporates simplified mathematical models of the lungs with O2 and CO2 exchange and transport processes coupled to a simplified model of the brainstem respiratory neural control network. The latter is represented by a pre-BötC oscillator (O) generating the inspiratory rhythm coupled to an inspiratory pattern generator in the rVRG that transforms the oscillatory drive signal into a ramping activity pattern [Rp(t)] via a neural integration (leaky integrator) process. The oscillator is modeled by activity-based [A(t)] descriptions that explicitly incorporate the kinetics of persistent sodium current inactivation to include a known biophysical mechanism allowing for frequency control by input drives (t in the model) over a wide dynamic range, as well as multistate behavior (no activity, oscillations, and tonic activity). The ramp waveform drives the force generator at the level of respiratory muscles (diaphragm), modeled as a spring excited by an external force that is proportional to the ramp signal. The lungs are modeled by a single container that has a moving plate attached to the spring causing changes in the pleural pressure (PL) surrounding the lungs, which causes the alveolar pressure (PA) to change resulting in air flow in and out of the lung (the PL and lung volume VA as a function of time are shown at the upper right). Gas exchange and transport are modeled by a “conveyor” model (top left). The moving “conveyor” is simulated by reinitializing the values of pc and po [the blood partial pressures of carbon dioxide and oxygen, respectively (middle top)), every heart beat (for more details see (12). The values of pc and po at the end of each interbeat interval represent the blood partial pressures at the end of the capillaries and are denoted by pce and poe, respectively. These values are updated every heart beat and are used to calculate input drives to the oscillator and ramp generator (t and K, respectively), which are the two control parameters in the model described by the feedback functions shown at the bottom left. These functions are formulated mathematically to represent two different types of feedback controllers (proportional and proportional plus integral controllers) from standard control theory that incorporate “error” terms (Erc, Ero, bottom left) and also the model accounts for delays associated with blood transport and dynamics of chemosensory-related afferent feedback signals. Full details of the model system components are provided in Ben-Tal and Smith (13) (Fig. 1, with permission from Elsevier).

Similar articles

Cited by

References

    1. Abbott LF. Theoretical neuroscience rising. Neuron. 2008;60:489–495. - PubMed
    1. Abbott SBG, Stornetta RL, Fortuna MG, Depuy SD, West GH, Harris TE, Guyenet PG. Photostimulation of retrotrapezoid nucleus Phox2b-expressing neurons in vivo produces long-lasting activation of breathing in rats. J Neurosci. 2009;29:5806–5819. - PMC - PubMed
    1. Abdala APL, Rybak IA, Smith JC, Paton JFR. Abdominal expiratory activity in the rat brainstem-spinal cord in situ: Patterns, origins and implications for respiratory rhythm generation. J Physiol. 2009;587:3539–3559. - PMC - PubMed
    1. Alheid GF, Gray PA, Jiang MC, Feldman JL, McCrimmon DR. Parvalbumin in respiratory neurons of the ventrolateral medulla of the adult rat. J Neurocytol. 2002;31:693–717. - PubMed
    1. Alheid GF, McCrimmon DR. The chemical neuroanatomy of breathing. Respir Physiol Neurobiol. 2008;164:3–11. - PMC - PubMed

Publication types

LinkOut - more resources