. 2013 Mar 1;2(3):e23562.
doi: 10.4161/onci.23562.

Tumor-associated macrophages subvert T-cell function and correlate with reduced survival in clear cell renal cell carcinoma

Affiliations

Tumor-associated macrophages subvert T-cell function and correlate with reduced survival in clear cell renal cell carcinoma

Stefanie Regine Dannenmann et al. Oncoimmunology. .

Abstract

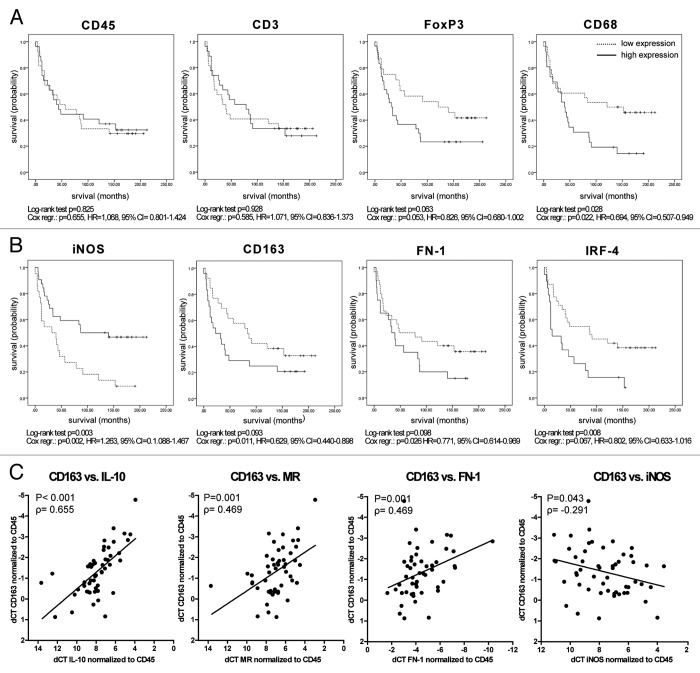
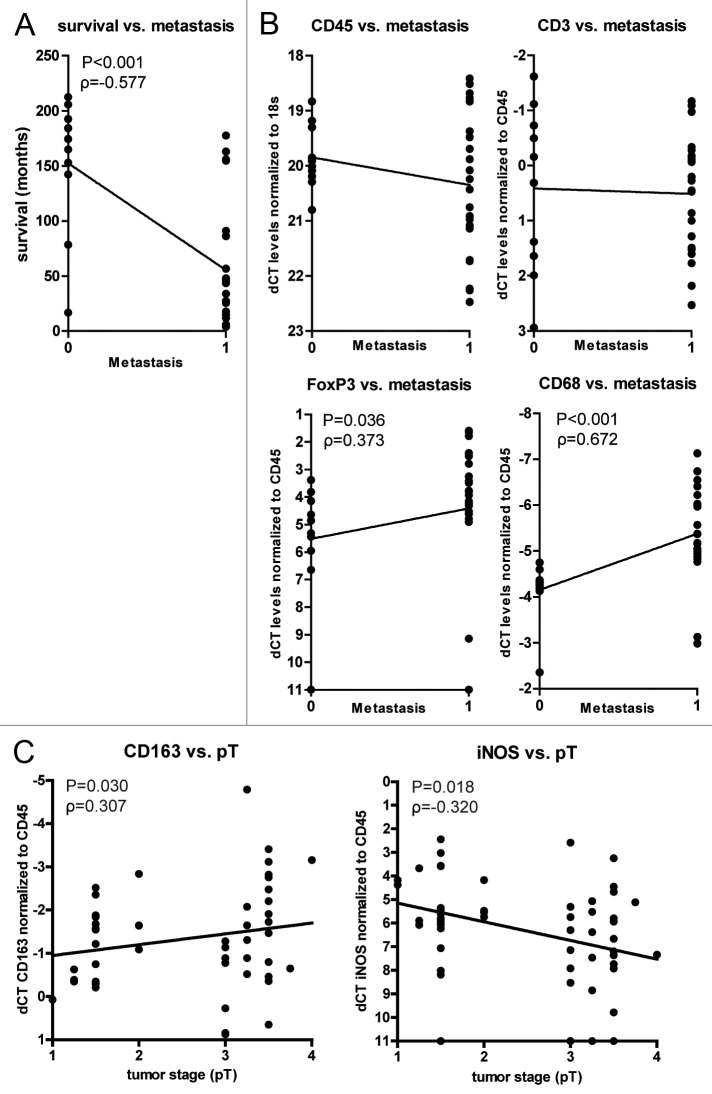
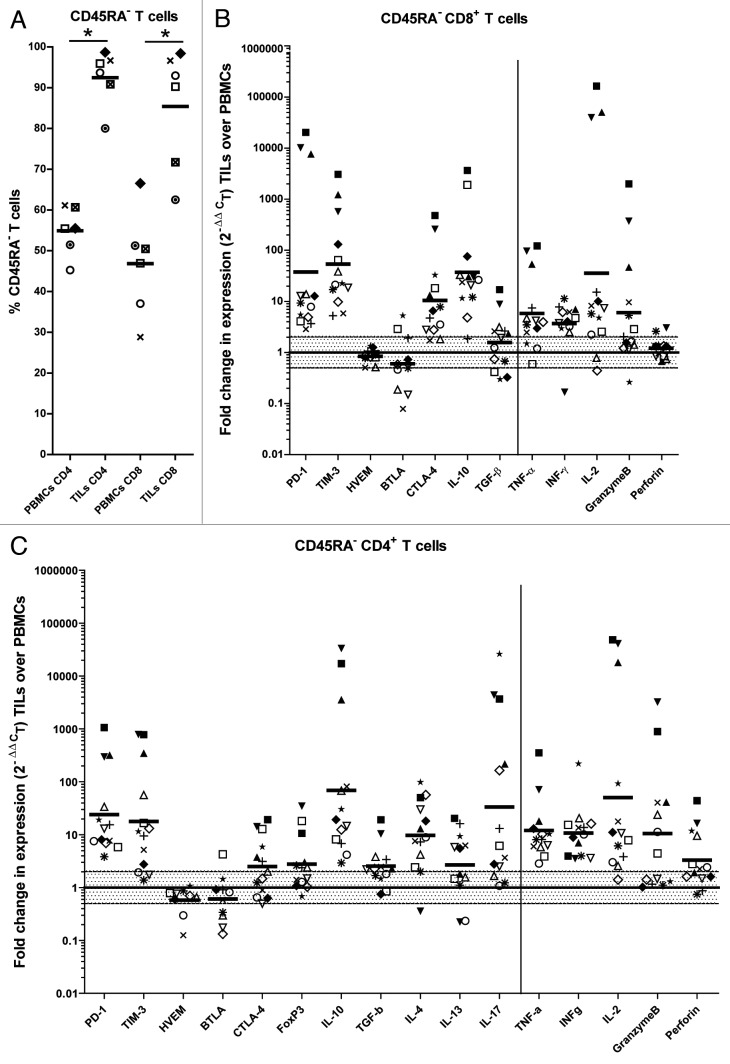
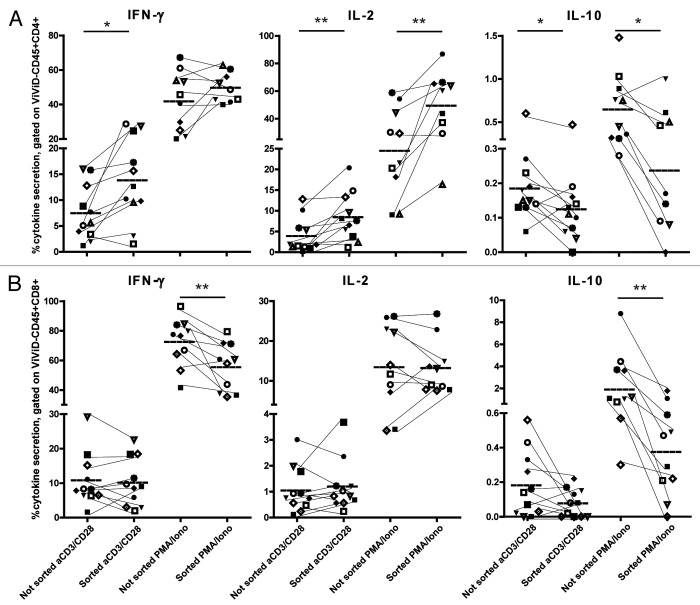
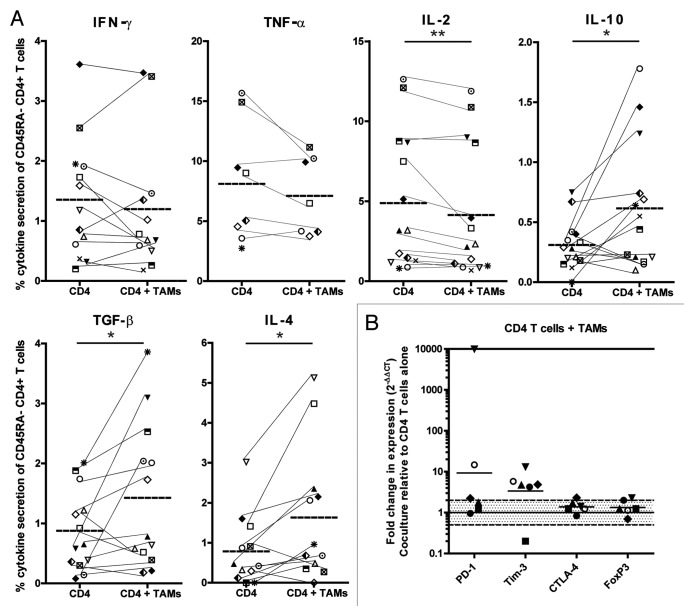
Although malignant cells can be recognized and controlled by the immune system, in patients with clinically apparent cancer immunosurveillance has failed. To better understand local immunoregulatory processes that impact on cancer progression, we correlated intratumoral immunological profiles with the survival of patients affected by primary clear cell renal cell carcinoma (ccRCC). A retrospective analysis of 54 primary ccRCC samples for 31 different immune response-related transcripts, revealed a negative correlation of CD68 (a marker of tumor-associated macrophages, TAMs) and FOXP3 (a marker of regulatory T cells, Tregs) with survival. The subsequent analysis of 12 TAM-related transcripts revealed an association between the genes coding for CD163, interferon regulatory factor 4 (IRF4) and fibronectin 1 (FN1), all of which have been linked to the M2 TAM phenotype, with reduced survival and increased tumor stage, whereas the opposite was the case for the M1-associated gene coding for inducible nitric oxide synthetase (iNOS). The M2 signature of (CD68+) TAMs was found to correlate with CD163 expression, as determined in prospectively collected fresh ccRCC tissue samples. Upon co-culture with autologous tumor cells, CD11b+ cells isolated from paired blood samples expressed CD163 and other M2-associated proteins, suggesting that the malignant cells promote the accumulation of M2 TAMs. Furthermore, the tumor-associated milieu as well as isolated TAMs induced the skewing of autologous, blood-derived CD4+ T cells toward a more immunosuppressive phenotype, as shown by decreased production of effector cytokines, increased production of interleukin-10 (IL-10) and enhanced expression of the co-inhibitory molecules programmed death 1 (PD-1) and T-cell immunoglobulin mucin 3 (TIM-3). Taken together, our data suggest that ccRCC progressively attracts macrophages and induces their skewing into M2 TAMs, in turn subverting tumor-infiltrating T cells such that immunoregulatory functions are increased at the expense of effector functions.

Keywords: T-cell response; clear cell renal cell carcinoma; immunoregulation; tumor immunology; tumor-associated macrophages.


Figures

None
Figure 1.FOXP3 and CD68 and genes associated to M2 tumor-associated macrophages inversely correlate with survival in clear cell renal cell carcinoma patients. (A–C) Fifty-four clear cell renal cell carcinoma (ccRCC) formalin-fixed paraffin-embedded (FFPE) tumor samples were subjected to a retrospective qRT-PCR analysis for different immune response-related genes. ∆Ct levels of CD45 were calculated by normalization to the endogenous control (18S rRNA), ∆Ct levels of all other genes were calculated by normalization to CD45. Survival analysis was performed using the Cox proportional hazard model and, after dichotomizing the data based on the mean-expression level, the log-rank test of the Kaplan-Meier estimator. The results of both statistical tests are displayed for selected genes. Patients that were still alive at time of analysis are marked with a tick. Kaplan-Meier survival curves show the relationship between gene expression and survival for CD45, CD3, FOXP3 and CD68 (A) and iNOS, CD163, FN1 and IRF4 (B). Multivariate Cox regression analysis revealed that the correlation of target gene expression and survival is independent of tumor grade for CD68: p = 0.02, hazard ratio (HR) = 0.704, 95% CI 0.520–0.954; iNOS: p = 0.011, HR = 1.261, 95% CI 1.055–1.506 and CD163 p = 0.015, HR = 0.645, 95% CI 0.453–0.919, as well as independent of patient age for CD68: p = 0.04, HR = 0.720, 95% CI 0.524–0.989; iNOS: p = 0.012, HR = 1.299, 95% CI 1.060–1.592 and CD163: p = 0.013, HR = 0.636, 95% CI 0.445–0.909. (C) ∆Ct levels of CD163 plotted against ∆Ct values of IL-10-, MR-, FN1- and iNOS-coding transcripts. Results of Spearman Rho correlation analysis are depicted. Each dot represents an individual patient.
None
Figure 2. Characterization of tumor-associated myeloid cells in clear cell renal cell carcinoma. (A–C) Fresh primary clear cell renal cell carcinoma (ccRCC) and paired peripheral blood samples were collected and processed as described under Materials and Methods. (A) Dot plots display the staining of peripheral blood mononuclear cells (PBMCs, left histogram) and processed tumors (right histogram) for CD11b and CD163 after gating on CD45+CD3CD19 cells. P1, T1 and T2 designate individual myeloid cell populations. The plots show a representative example of one patient. (B) Expression of different macrophage-associated molecules after gating on P1, T1 and T2 populations, displayed as the geometric mean of fluorescence intensity. Each symbol represents an individual patient; means and significant differences (*p < 0.05) are displayed. (C) qRT-PCR analysis of FACS-sorted P1 and T2 cell fractions. The genes displayed on the left side of the vertical line are related to M2 TAMs, on the right side to M1 TAMs. ∆Ct levels were calculated upon normalization to the endogenous control PPIA. Results are presented as fold change in expression level of T2 relative to P1; the geometric mean of each group is depicted. Fold differences in expression within the shaded area are considered as not significant. Symbols at the 0.0001 line on the y-axis represent samples for which the fold change could not be calculated, since the expression was only detected in the P1 fraction. Each symbol in (B) and (C) represents an individual patient.
None
Figure 3. Positive correlation of FOXP3 and CD68 gene expression with the incidence of metastasis and of M2-associated genes with tumor stage. (A) Survival in months after diagnosis versus incidence of metastasis. (B) The ∆Ct values of CD45, CD3, FOXP3 and CD68 correlated with the incidence of metastasis (0 = patient did not develop metastasis, 1 = patient developed metastasis). (C) The ∆Ct values of CD163 and iNOS correlated with tumor stage (pT). Each dot represents an individual patient. ∆Ct levels were calculated as in the legend of Figure 1. Only when correlations are significant, the results of the Spearman Rho correlation test are displayed. Tumor stage was defined as: 1 = pT1, 1.25 = pT1a, 1.5 = pT1b, 2 = pT2, 3 = pT3, 3.25 = pT3a, 3.5 = pT3b, 3.75 = pT3c and 4 = pT4.
None
Figure 4. Tumor-derived T cells show an antigen-experienced and regulated phenotype. (A) The percentage of CD45RA (antigen-experienced) T cells in the peripheral blood and tumors of clear cell renal cell carcinoma (ccRCC) patients was determined by flow cytometry; the means of each group and significant differences (*p < 0.05) are displayed. (B and C) Gene expression analysis was performed by qRT-PCR on FACS-sorted CD45RACD8+ (B) and CD45RACD4+ (C) cells from the peripheral blood and tumors of ccRCC patients. Ct values were normalized to the endogenous control PPIA. The genes displayed on the left side of the vertical lines are related to immunoregulation, on the right side to effector functions. Results are presented as fold change in expression level of tumor-derived relative to peripheral blood-derived T cells; the geometric mean of each group is depicted; fold differences in expression within the shaded area are considered as not significant. Each symbol represents an individual patient.
None
Figure 5. Tumor-derived T cells express higher levels of regulatory molecules than T cells derived from paired blood samples. (A and B) FACS analysis on tumor- and peripheral blood-derived cells after gating on CD8+CD45RA- T cells (A) or CD4+CD45RA T cells (B). The graphs display the percentage of cells positive for a particular marker. A representative staining is shown in Figure S4. Each symbol represents an individual patient. The mean of each group and significant differences (*p < 0.05; **p < 0.005; ***p < 0.0005) are depicted.
None
Figure 6. The tumor microenvironment impacts on the cytokine profile of T cells. Intracellular staining for cytokines after 6h ex vivo stimulation with anti-CD3/CD28 beads or with phorbol 12-myristate 13-acetate (PMA) + ionomycin in the presence of brefeldin A and monensin. Cells were stimulated within the tumor single-cell suspension or after sorting of CD45+CD4+ T cells (A) or CD45+CD8+ T cells (B) and analyzed after gating on live CD45+CD4+ T cells (A) or live CD45+CD8+ T cells (B). Each symbol represents an individual patient. Results of unsorted and sorted T cells from the same patient are connected by a thin line. The mean of each group and significant differences (*p < 0.05; **p < 0.005) are depicted.
None
Figure 7. Clear cell renal cell carcinoma-derived M2 tumor-associated macrophages skew T cells toward a more regulated phenotype. (A and B) Sorted peripheral blood-derived CD4+ T cells were cultured for 48 h with or without sorted autologous T2 cells (CD45+CD2CD19CD11b+CD163high) in a ratio of 1:1. (A) The production of cytokines was assessed via intracellular cytokine stating 6 h after ex vivo stimulation with anti-CD3/CD28 beads in the presence of brefeldin A and monensin upon gating on live CD45+CD11bCD4+ cells. Results of the same patient are connected by a thin line. The mean of each group and significant differences (* p < 0.05; ** p < 0.005) are depicted. (B) The expression of regulatory molecules was assessed by qRT-PCR. ∆Ct levels were calculated by normalizing the Ct values of the target genes to the Ct values of CD4. Results are presented as fold change in expression level of CD4+ T cells co-cultured in the presence of autologous T2 (CD45+CD2CD19CD11b+CD163high) cells relative to CD4+ T cells cultured in their absence. Fold differences in expression within the shaded area are considered as not significant. The symbol at the 10,000 line on the y-axis represents a sample of which fold change could not be calculated, since expression was only detected after co-culture. Each symbol represents an individual patient.

References

    1. Fridman WH, Pagès F, Sautès-Fridman C, Galon J. The immune contexture in human tumours: impact on clinical outcome. Nat Rev Cancer. 2012;12:298–306. doi: 10.1038/nrc3245. - DOI - PubMed
    1. Schreiber RD, Old LJ, Smyth MJ. Cancer immunoediting: integrating immunity’s roles in cancer suppression and promotion. Science. 2011;331:1565–70. doi: 10.1126/science.1203486. - DOI - PubMed
    1. Beck C, Schreiber H, Rowley D. Role of TGF-beta in immune-evasion of cancer. Microsc Res Tech. 2001;52:387–95. doi: 10.1002/1097-0029(20010215)52:4<387::AID-JEMT1023>3.0.CO;2-W. - DOI - PubMed
    1. Kawamura K, Bahar R, Natsume W, Sakiyama S, Tagawa M. Secretion of interleukin-10 from murine colon carcinoma cells suppresses systemic antitumor immunity and impairs protective immunity induced against the tumors. Cancer Gene Ther. 2002;9:109–15. doi: 10.1038/sj.cgt.7700418. - DOI - PubMed
    1. Sica A, Schioppa T, Mantovani A, Allavena P. Tumour-associated macrophages are a distinct M2 polarised population promoting tumour progression: potential targets of anti-cancer therapy. Eur J Cancer. 2006;42:717–27. doi: 10.1016/j.ejca.2006.01.003. - DOI - PubMed

Publication types