

Clinal distribution of human genomic diversity across the Netherlands despite archaeological evidence for genetic discontinuities in Dutch population history
- PMID: 23687922
- PMCID: PMC3707805
- DOI: 10.1186/2041-2223-4-9
Clinal distribution of human genomic diversity across the Netherlands despite archaeological evidence for genetic discontinuities in Dutch population history
Abstract
Background: The presence of a southeast to northwest gradient across Europe in human genetic diversity is a well-established observation and has recently been confirmed by genome-wide single nucleotide polymorphism (SNP) data. This pattern is traditionally explained by major prehistoric human migration events in Palaeolithic and Neolithic times. Here, we investigate whether (similar) spatial patterns in human genomic diversity also occur on a micro-geographic scale within Europe, such as in the Netherlands, and if so, whether these patterns could also be explained by more recent demographic events, such as those that occurred in Dutch population history.
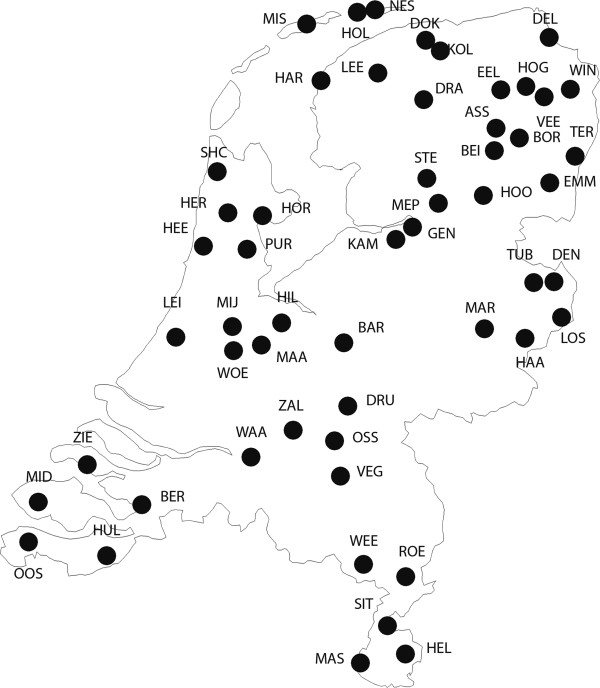
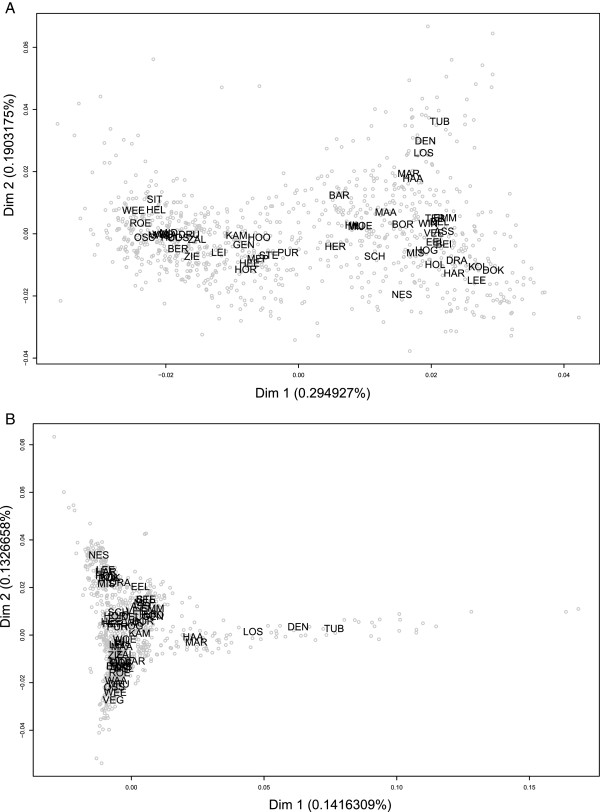
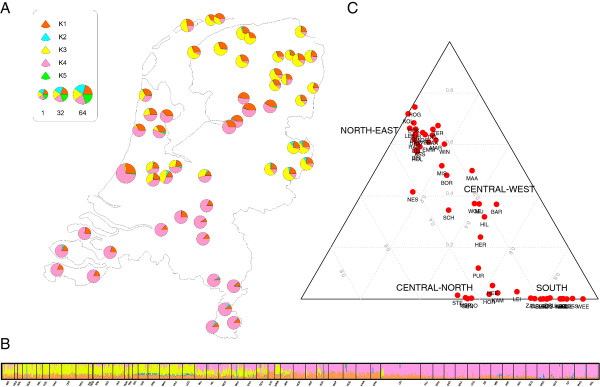
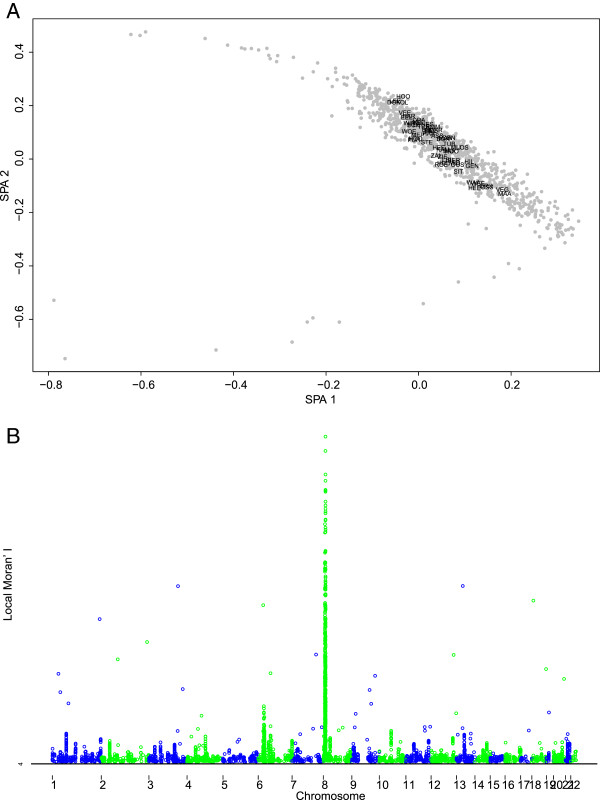
Methods: We newly collected data on a total of 999 Dutch individuals sampled at 54 sites across the country at 443,816 autosomal SNPs using the Genome-Wide Human SNP Array 5.0 (Affymetrix). We studied the individual genetic relationships by means of classical multidimensional scaling (MDS) using different genetic distance matrices, spatial ancestry analysis (SPA), and ADMIXTURE software. We further performed dedicated analyses to search for spatial patterns in the genomic variation and conducted simulations (SPLATCHE2) to provide a historical interpretation of the observed spatial patterns.
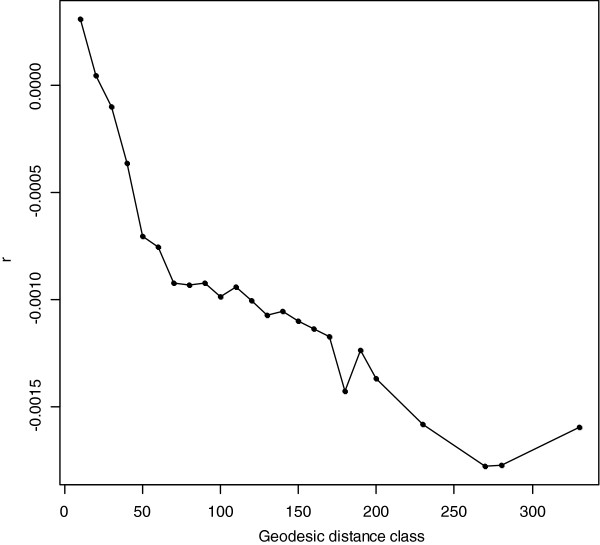
Results: We detected a subtle but clearly noticeable genomic population substructure in the Dutch population, allowing differentiation of a north-eastern, central-western, central-northern and a southern group. Furthermore, we observed a statistically significant southeast to northwest cline in the distribution of genomic diversity across the Netherlands, similar to earlier findings from across Europe. Simulation analyses indicate that this genomic gradient could similarly be caused by ancient as well as by the more recent events in Dutch history.
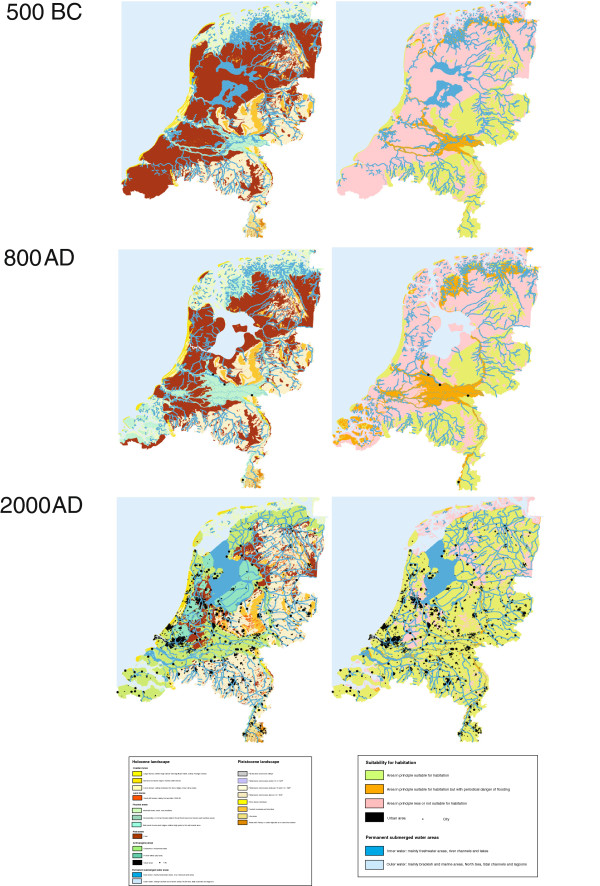
Conclusions: Considering the strong archaeological evidence for genetic discontinuity in the Netherlands, we interpret the observed clinal pattern of genomic diversity as being caused by recent rather than ancient events in Dutch population history. We therefore suggest that future human population genetic studies pay more attention to recent demographic history in interpreting genetic clines. Furthermore, our study demonstrates that genetic population substructure is detectable on a small geographic scale in Europe despite recent demographic events, a finding we consider potentially relevant for future epidemiological and forensic studies.
Figures
References
-
- Cavalli-Sforza LL, Menozzi P, Piazza A. The history and geography of human genes. Princeton (NJ): Princeton University Press; 1994.
-
- Lao O, Lu TT, Nothnagel M, Junge O, Freitag-Wolf S, Caliebe A, Balascakova M, Bertranpetit J, Bindoff LA, Comas D, Holmlund G, Kouvatsi A, Macek M, Mollet I, Parson W, Palo J, Ploski R, Sajantila A, Tagliabracci A, Gether U, Werge T, Rivadeneira F, Hofman A, Uitterlinden AG, Gieger C, Wichmann HE, Ruther A, Schreiber S, Becker C, Nurnberg P, Nelson MR, Krawczak M, Kayser M. Correlation between genetic and geographic structure in Europe. Curr Biol. 2008;18:1241–1248. doi: 10.1016/j.cub.2008.07.049. - DOI - PubMed
LinkOut - more resources
Full Text Sources
Other Literature Sources
Research Materials
Miscellaneous
