. 2013 May 20:12:50.
doi: 10.1186/1475-2859-12-50.

Accumulation of inorganic polyphosphate enables stress endurance and catalytic vigour in Pseudomonas putida KT2440

Affiliations

Accumulation of inorganic polyphosphate enables stress endurance and catalytic vigour in Pseudomonas putida KT2440

Pablo I Nikel et al. Microb Cell Fact. .

Abstract

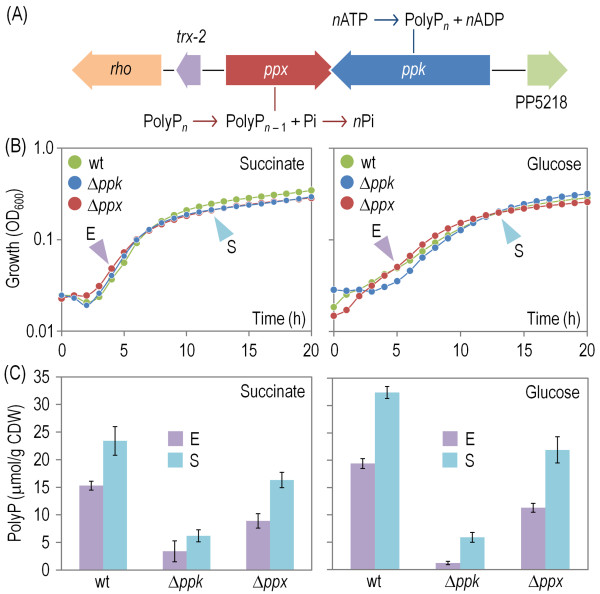
Background: Accumulation of inorganic polyphosphate (polyP), a persistent trait throughout the whole Tree of Life, is claimed to play a fundamental role in enduring environmental insults in a large variety of microorganisms. The share of polyP in the tolerance of the soil bacterium Pseudomonas putida KT2440 to a suite of physicochemical stresses has been studied on the background of its capacity as a host of oxidative biotransformations.

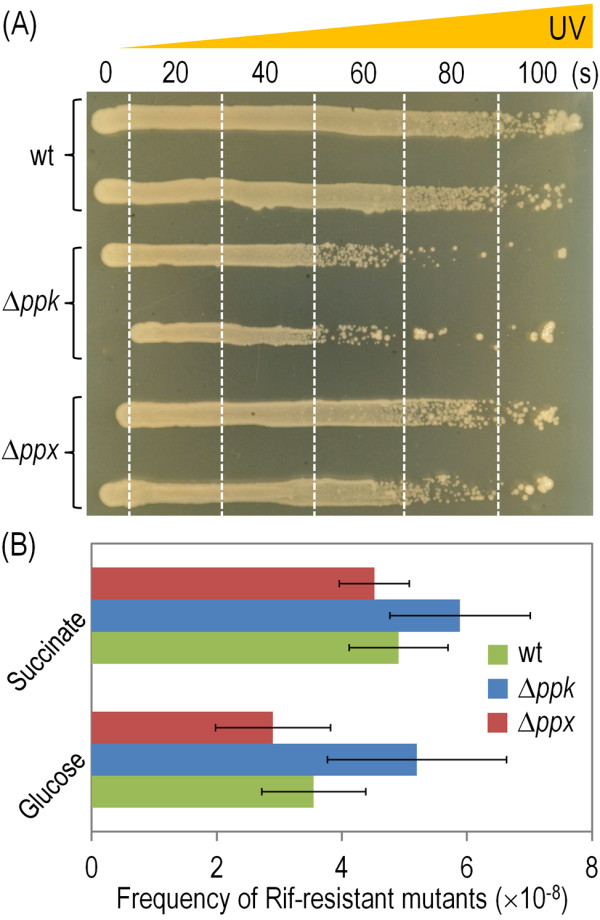
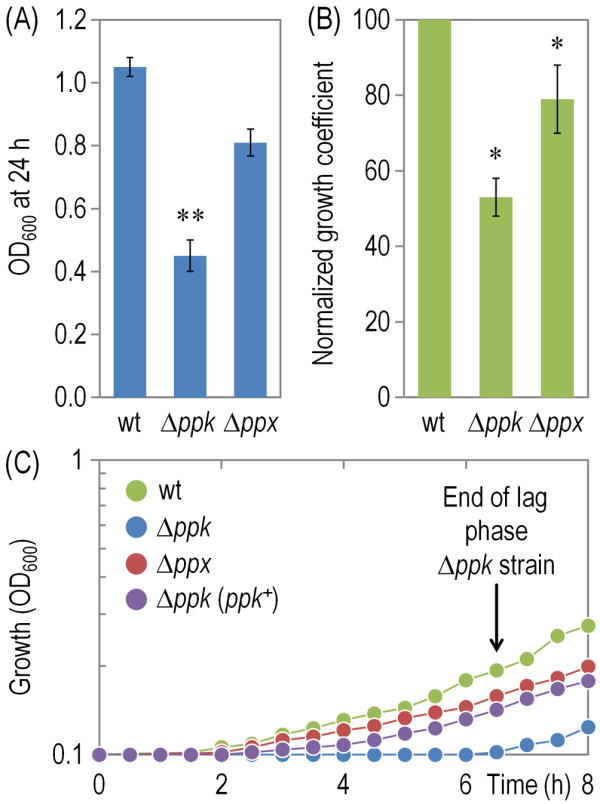
Results: Cells lacking polyphosphate kinase (Ppk), which expectedly presented a low intracellular polyP level, were more sensitive to a number of harsh external conditions such as ultraviolet irradiation, addition of β-lactam antibiotics and heavy metals (Cd(2+) and Cu(2+)). Other phenotypes related to a high-energy phosphate load (e.g., swimming) were substantially weakened as well. Furthermore, the ppk mutant was consistently less tolerant to solvents and its survival in stationary phase was significantly affected. In contrast, the major metabolic routes were not significantly influenced by the loss of Ppk as diagnosed from respiration patterns of the mutant in phenotypic microarrays. However, the catalytic vigour of the mutant decreased to about 50% of that in the wild-type strain as estimated from the specific growth rate of cells carrying the catabolic TOL plasmid pWW0 for m-xylene biodegradation. The catalytic phenotype of the mutant was restored by over-expressing ppk in trans. Some of these deficits could be explained by the effect of the ppk mutation on the expression profile of the rpoS gene, the stationary phase sigma factor, which was revealed by the analysis of a PrpoS → rpoS'-'lacZ translational fusion. Still, every stress-related effect of lacking Ppk in P. putida was relatively moderate as compared to some of the conspicuous phenotypes reported for other bacteria.

Conclusions: While polyP can be involved in a myriad of cellular functions, the polymer seems to play a relatively secondary role in the genetic and biochemical networks that ultimately enable P. putida to endure environmental stresses. Instead, the main value of polyP could be ensuring a reservoire of energy during prolonged starvation. This is perhaps one of the reasons for polyP persistence in live systems despite its apparent lack of essentiality.


Figures

Figure 1
Figure 1
Main bioreactions for polyphosphate (polyP) biosynthesis and degradation and accumulation levels in P. putida KT2440. (A) Organization of genes involved in polyP metabolism in P. putida. Bioreactions catalyzed by polyP kinase (Ppk) and exopolyphosphatase (Ppx, annotated as a Ppx/GppA phosphatase) are outlined along with the gene encoding the corresponding enzyme involved in that transformation step. Relevant ORFs surrounding the polyP-genes locus are rho (encoding a Rho transcriptional terminator factor), trx-2 (encoding a thioredoxin protein) and PP5218 (encoding a DedA family protein). Elements in this outline are not drawn to scale. (B) Growth curves for P. putida KT2440 (wt) and its Δppk and Δppx mutant derivatives developed under both glycolytic and gluconeogenic regimes. Experiments were conducted in M9 minimal medium with 0.2% (w/v) glucose or succinate as the sole C source as indicated in each plot. Time points in which the polyP content was assessed are identified with slanted arrows during both exponential growth (E) and in the stationary phase (S) (see below). Results represent the average of five independent replicates from at least three independent cultures, and error bars (consistently <10% of the means) are omitted here for the sake of clarity. (C) PolyP accumulation in P. putida KT2440 (wt) and its Δppk and Δppx mutant derivatives. Determinations were carried out in cells grown on M9 minimal medium with 0.2% (w/v) glucose or succinate as the sole C source as indicated in each plot either during exponential growth (E) and in the stationary phase (S). The polyP concentration was normalized to the cell dry weight (CDW) in each determination. Each bar represents the mean value of the polyP content ± SD of duplicate measurements from at least three independent experiments, and the asterisk identifies a significant difference at the P < 0.05 level (ANOVA).
Figure 2
Figure 2
Motility and biofilm formation by P. putida KT2440 and its Δppk and Δppx mutant derivatives. (A) Swimming motility experiments performed in semi-solid M9 minimal medium agar plates for P. putida KT2440 (wt) and its Δppk and Δppx mutant derivatives. Two μl of a cell suspension of each strain (OD600 = 3.0) were inoculated onto the plate and photographed after 48 h of incubation at 30°C. A ΔfliM mutant (i.e., a flagellum-less strain) was used as a negative swimming control. (B) Biofilm formation. Assays were performed in multi-well plates using the crystal violet method explained in the Methods section. Comparison of biofilms formed by P. putida KT2440 (wt) and its Δppk and Δppx mutant derivatives was conducted by calculating the corresponding biofilm index values on each of the C sources tested (glucose, citrate and glycerol). Error bars represent the mean value of the biofilm index value ± SD of seven measurements from at least three independent experiments.
Figure 3
Figure 3
Resistance to physico-chemical insults in P. putida KT2440 and its Δppk and Δppx mutant derivatives. (A) Solvent tolerance and heat-shock response. Cells were cultured on LB medium and exposed to the different physicochemical stress agents as detailed in the Methods section. The percentage of survival was calculated as the fraction of colony-forming units after the treatment normalized to those in the untreated control experiment. Error bars represent the mean value of the percentage of survival ± SD of three independent replicates from at least two independent cultures, and asterisks identify significant differences at the P < 0.05 (*) or P < 0.01 (**) levels (ANOVA). (B) Growth inhibition by heavy metals in M9 minimal medium containing 0.2% (w/v) glucose or succinate as the sole C source. Experiments were performed in the presence of either 0.1 mM Cd2+ or 0.1 mM Cu2+ as indicated, and the percentages of growth inhibition were calculated at 24 h by comparing the growth of the mutants with that of P. putida KT2440. Error bars represent the mean value of the percentage of growth inhibition ± SD of three independent replicates from at least three independent cultures. All the differences in this parameter were significant (P < 0.05, ANOVA) as compared to the growth inhibition of P. putida KT2440.
Figure 4
Figure 4
Survival and PrpoSactivity in P. putida KT2440 and its Δppk and Δppx mutant derivatives. (A) Propidium iodide (PI) test to estimate cell viability in P. putida KT2440 (wt) and the Δppk and Δppx mutants. Stationary-phase cell suspensions grown on M9 minimal medium with either 0.2% (w/v) glucose or succinate were stained with PI and analysed by flow cytometry as detailed in the Methods section. Box plots represent the median value and the 1st and 3rd quartiles of the geometric mean values of quadruplicate determinations from three independent cultures, and asterisks identify significant differences at the P < 0.05 (*) or P < 0.01 (**) levels as assessed with the Mann–Whitney U test. (B) The ability of P. putida KT2440 (wt) and the Δppk and Δppx mutants to form colonies when transferred into fresh medium was evaluated by plating appropriate dilutions of the stationary-phase cell suspensions onto LB plates. Bars represent the mean value ± SD of three measurements from at least three independent experiments, and the asterisk identifies a significant difference at the P < 0.05 level (ANOVA). (C) Scheme of the relevant elements of the PrpoS translational fusion borne by plasmid pMCH4. The T0 transcriptional terminator from phage λ is denoted as T. Elements in this outline are not drawn to scale. (D) Expression of the PrpoSrpoS‘-’lacZ translational fusion (β-galactosidase activity) monitored in P. putida KT2440 (wt) and the Δppk and Δppx mutants. Cells were grown on M9 minimal medium with 0.2% (w/v) glucose and 150 μg/ml kanamycin, and harvested during exponential growth (E) or in the stationary phase (S). Bars represent the mean value of the reporter activity ± SD of duplicate measurements from at least three independent experiments. Asterisks identify significant differences at the P < 0.05 level (ANOVA).
Figure 5
Figure 5
UV-light survival and mutagenesis in P. putida KT2440 and its Δppk and Δppx mutant derivatives. (A) UV sensitivity tests were performed in P. putida KT2440 (wt) and its Δppk and Δppx mutant derivatives streaked out onto LB plates by means of a gradient of UV irradiation (with exposure time ranging from 0 to 100 s). Irradiations were performed at 254 nm (400 μW/cm2), and the boundaries of different irradiation periods of time are indicated by vertical dashed lines. (B) Frequency of spontaneous Rif-resistant mutants in stationary-phase cells of P. putida KT2440 (wt) and its Δppk and Δppx mutant derivatives grown on M9 minimal medium with either 0.2% (w/v) glucose or succinate. Frequencies were calculated by dividing the average number of Rif-resistant colonies by the total number of viable cells in the same culture. Bars represent the mean value of the frequency of Rif-resistant clones ± SD of duplicate measurements from at least two independent experiments.
Figure 6
Figure 6
Catalytic vigour test for P. putida KT2440 and its Δppk and Δppx mutant derivatives. (A) Final biomass concentration (estimated from OD600 readings) for cultures of P. putida KT2440 (wt) and its Δppk and Δppx mutant derivatives grown in M9 minimal medium containing m-xylene as the sole C source. Bars represent the mean value of the OD600 readings ± SD of duplicate measurements from at least three independent experiments, and asterisks (**) identify significant differences at the P < 0.01 level (ANOVA). (B) Normalized growth coefficients for cultures of P. putida KT2440 (wt) and its Δppk and Δppx mutant derivatives grown in M9 minimal medium containing m-xylene as the sole C source, representing the fraction of the specific growth rate attained by mutant cells when compared to that computed for P. putida KT2440 (arbitrarily set to 100%). Bars represent the mean value of the normalized growth coefficient ± SD of triplicate measurements from at least four independent experiments, and asterisks (*) identify significant differences at the P < 0.05 level (ANOVA). (C) Growth kinetics for cultures of P. putida KT2440 (wt) and its Δppk and Δppx mutant derivatives, as well as the Δppk mutant complemented with ppk in trans (ppk+), grown in M9 minimal medium containing m-xylene as the sole C source. Expression of ppk (under control of a XylS/Pm element in plasmid pSEM-ppk) was induced by addition of 2.5 mM 3-methylbenzoate to the cultures upon inoculation. Growth trajectories in control experiments, run with the same strains carrying pSEVA238 [54], the empty expression vector used to complement ppk, were indistinguishable to those shown in this figure (not shown). Results represent the average of three independent replicates from at least two independent cultures. Error bars (<20% of the means) were omitted for the sake of clarity.

Similar articles

Cited by

References

    1. Domínguez-Cuevas P, González-Pastor JE, Marqués S, Ramos JL, de Lorenzo V. Transcriptional tradeoff between metabolic and stress-response programs in Pseudomonas putida KT2440 cells exposed to toluene. J Biol Chem. 2006;281:11981–11991. doi: 10.1074/jbc.M509848200. - DOI - PubMed
    1. Reva ON, Weinel C, Weinel M, Bohm K, Stjepandic D, Hoheisel JD, Tümmler B. Functional genomics of stress response in Pseudomonas putida KT2440. J Bacteriol. 2006;188:4079–4092. doi: 10.1128/JB.00101-06. - DOI - PMC - PubMed
    1. Blank LM, Ionidis G, Ebert BE, Bühler B, Schmid A. Metabolic response of Pseudomonas putida during redox biocatalysis in the presence of a second octanol phase. FEBS J. 2008;275:5173–5190. doi: 10.1111/j.1742-4658.2008.06648.x. - DOI - PubMed
    1. Chavarría M, Nikel PI, Pérez-Pantoja D, de Lorenzo V. The Entner-Doudoroff pathway empowers Pseudomonas putida KT2440 with a high tolerance to oxidative stress. Environ Microbiol. 2013. In press. - DOI - PubMed
    1. Rao NN, Gómez-García MR, Kornberg A. Inorganic polyphosphate: essential for growth and survival. Annu Rev Biochem. 2009;78:605–647. doi: 10.1146/annurev.biochem.77.083007.093039. - DOI - PubMed

Publication types