. 2013 May 20:10:52.
doi: 10.1186/1742-4690-10-52.

Interferon-α (IFN-α) suppresses HTLV-1 gene expression and cell cycling, while IFN-α combined with zidovudine induces p53 signaling and apoptosis in HTLV-1-infected cells

Affiliations

Interferon-α (IFN-α) suppresses HTLV-1 gene expression and cell cycling, while IFN-α combined with zidovudine induces p53 signaling and apoptosis in HTLV-1-infected cells

Shuichi Kinpara et al. Retrovirology. .

Abstract

Background: Human T-cell leukemia virus type-1 (HTLV-1) is the causative retrovirus of adult T-cell leukemia/lymphoma (ATL) and HTLV-1-associated myelopathy/tropical spastic paraparesis (HAM/TSP). HTLV-1 gene expression is maintained at low levels in vivo by unknown mechanisms. A combination therapy of interferon-α (IFN-α) and zidovudin (AZT) shows therapeutic effects in ATL patients, although its mechanism is also obscure. We previously found that viral gene expression in IL-2-dependent HTLV-1-infected T-cells (ILTs) derived from ATL patients was markedly suppressed by stromal cells through a type I IFN response. Here, we investigated the effects of IFN-α with or without AZT on viral gene expression and cell growth in ILTs.

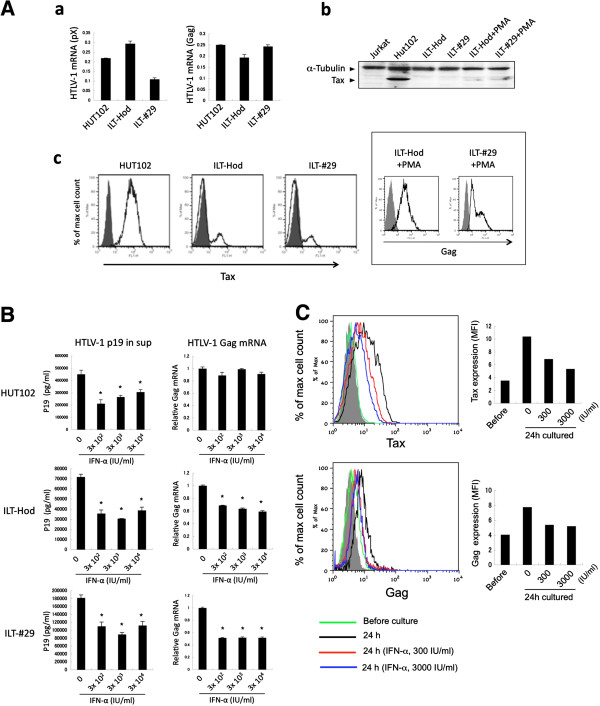
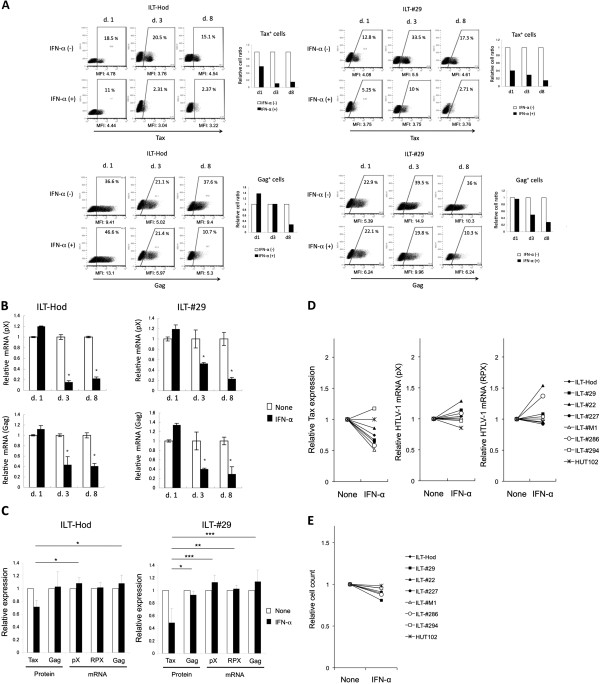
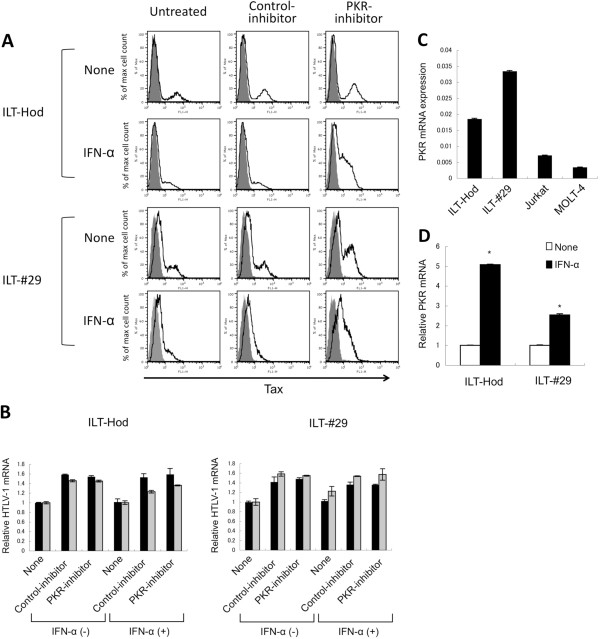
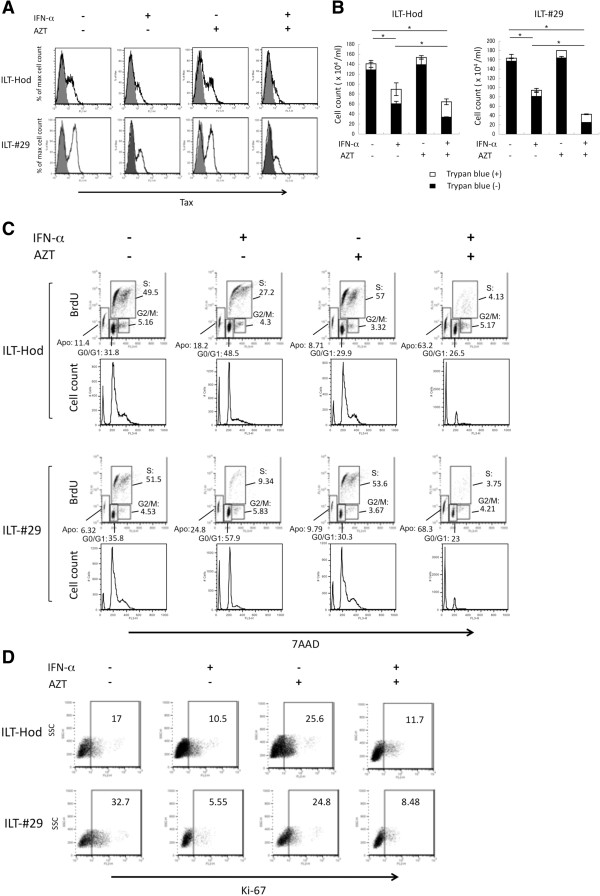
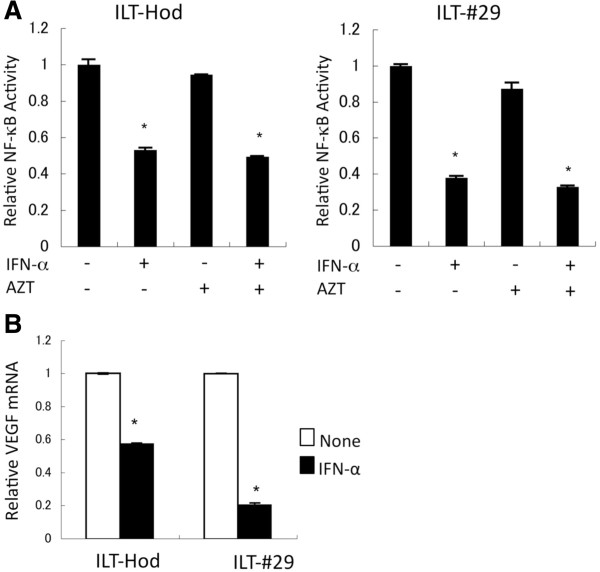
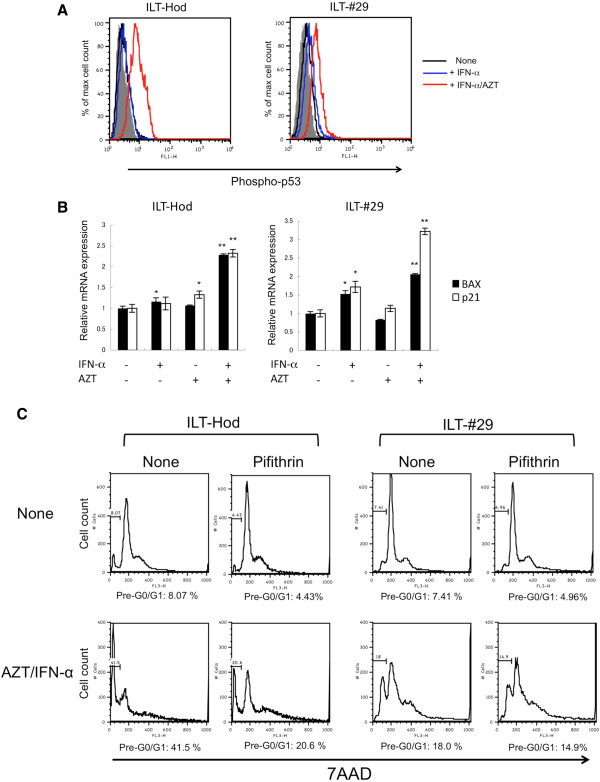
Results: ILTs expressed variable but lower amounts of HTLV-1 Tax protein than HTLV-1-transformed HUT102 cells. Following the addition of IFN-α, the amounts of HTLV-1 p19 in the supernatants of these cells decreased in three days, while HTLV-1 gene expression decreased only in ILTs but not HUT102 cells. IFN-α also suppressed the spontaneous HTLV-1 induction in primary ATL cells cultured for 24 h. A time course study using ILTs revealed that the levels of intracellular Tax proteins decreased in the first 24 h after addition of IFN-α, before the reduction in HTLV-1 mRNA levels. The initial decreases of Tax protein following IFN-α treatment were observed in 6 of 7 ILT lines tested, although the reduction rates varied among ILT lines. An RNA-dependent protein kinase (PKR)-inhibitor reversed IFN-mediated suppression of Tax in ILTs. IFN-α also induced cell cycle arrest at the G0/G1 phase and suppressed NF-κB activities in these cells. AZT alone did not affect HTLV-1 gene expression, cell viability or NF-κB activities. AZT combined with IFN-α markedly induced cell apoptosis associated with phosphorylation of p53 and induction of p53-responsive genes in ILTs.

Conclusions: IFN-α suppressed HTLV-1 gene expression at least through a PKR-mediated mechanism, and also induced cell cycle arrest in ILTs. In combination with AZT, IFN-α further induced p53 signaling and cell apoptosis in these cells. These findings suggest that HTLV-1-infected cells at an IL-2-dependent stage retain susceptibility to type I IFN-mediated regulation of viral expression, and partly explain how AZT/IFN-α produces therapeutic effects in ATL.


Figures

Figure 1
Figure 1
Effects of IFN-α treatment on HTLV-1 p19 release and viral transcription in various HTLV-1-infected cell lines. A. Expression of HTLV-1 mRNAs (a) and proteins (b, c) were evaluated by quantitative RT-PCR (a), immunoblotting (b), and flow cytometry (c), respectively, in HTLV-1-infected HUT102, ILT-Hod and ILT-#29 or uninfected Jurkat cell lines. a. The mRNA copy numbers measured by using pX or Gag primers were standardized to those for GAPDH and indicated as the means and standard deviations (SD) of duplicate samples. b. Cell lysates from indicated cell lines were subjected to an immunoblotting assay with antibodies to Tax (40 kDa) and α-Tubulin (50 kDa). The lysates in lanes 5 and 6 were prepared from ILT-Hod and ILT-#29 cells stimulated with PMA (50 ng/ml) overnight, respectively. c. Intracellular Tax proteins in permeabilized cells were stained with Alexa Fluor 488-labeled anti-Tax mAb (open histogram) and mouse IgG3 isotype control antibody (closed histogram). The inserted box indicates Gag expression in ILT-Hod and ILT-#29 cells stimulated with PMA (50 ng/ml) for 17h. B. HUT102 (top), ILT-Hod (middle) and ILT-#29 (bottom) cells were cultured for 3 days with or without three doses of IFN-α indicated. HTLV-1 p19 concentrations in the supernatants (left) and Gag mRNA levels were measured by ELISA and quantitative RT-PCR, respectively. Data are presented as the means and SD of duplicate samples. C. Frozen stored primary ATL cells were thawed and analyzed for intracellular Tax (top) or Gag (bottom) proteins by flow cytometry immediately (green line) or 24 h after culture with no (black line), 300 IU/ml (red line) or 3000 IU/ml (blue line) of IFN-α in the presence of IL-2 (30 IU/ml). The closed histogram represents samples stained with isotype controls. The mean fluorescence intensity (MFI) of each histogram was indicated in the bar graphs.
Figure 2
Figure 2
IFN-α suppressed Tax protein expression before an apparent reduction in HTLV-1 mRNA levels. A. The effects of IFN-α (3000 IU/ml) on intracellular Tax (top) and Gag (bottom) protein expression in ILT-Hod (left) and ILT-#29 (right) cells was evaluated by flow cytometry on days 1, 3, and 8 of culture. Cells stained with isotype antibodies served as negative controls. The values inside the dot plots represent percentages of viral protein-expressing cells, and the relative values in IFN-α-treated (closed bar) against untreated (open bar) samples are shown in the bar graph. The MFI value of the total cell population is indicated below the dot plots. B. Expression of HTLV-1 mRNA in the same cell samples prepared in A was evaluated by quantitative RT-PCR using pX (top) and Gag (bottom) primers. Results are standardized and presented as relative values of IFN-α-treated (closed bar) against untreated (open bar) samples. The means and SD of duplicate samples are indicated. *p < 0.05. C. HTLV-1 proteins (Tax and Gag) and HTLV-1 mRNAs expression in ILT-Hod and ILT-#29 cells were measured 24 h after incubation with (closed bar) or without (open bar) IFN-α, and the relative values were indicated as the means and SD of three independent experiments. Three different primer sets (pX, RPX, and Gag) were used to quantify HTLV-1 mRNAs. D. Seven ILT lines from various patients and HUT102 were cultured with or without IFN-α for 24 h, and the proportions of Tax positive cells (left) and the HTLV-1 mRNA quantified using pX (middle) and RPX (right) primers were indicated as relative values against the sample without IFN-α. E. Various HTLV-1-infected T cell lines shown in D were cultured with or without IFN-α for 3–4 days, and viable cell numbers analyzed by a colorimetric assay were indicated as relative values.
Figure 3
Figure 3
Involvement of PKR in IFN-α-mediated reduction of Tax protein levels in HTLV-1-infected cells. A. ILT-Hod and ILT-#29 cells were incubated with or without the PKR-inhibitor (500 nM) or the negative control-inhibitor (500 nM) for the first 2 h, then further cultured for the next 24 h in the presence or absence of IFN-α (3000 IU/ml) as indicated. Flow cytometry was then performed following stained with anti-Tax (open histogram) and isotype control (closed histogram) antibodies. B. HTLV-1 pX mRNAs in the same samples prepared in A were quantified by RT-PCR using two different primer sets (RPX; black bar, and pX; gray bar), standardized to GAPDH mRNAs, and the relative values were indicated as the means and SD of duplicate samples. C. PKR mRNAs in ILT-Hod, ILT-#29, and HTLV-1-negative Jurkat and MOLT4 cells were quantified by RT-PCR, standardized to GAPDH mRNA and indicated as the means and SD of duplicate samples. D. PKR mRNAs in ILT-Hod and ILT-#29 cells were quantified 24 h after culture in the absence (open bar) or presence (closed bar) of IFN-α (3000 IU/ml), and the relative values are indicated as the means and SD of duplicate samples. *p < 0.05.
Figure 4
Figure 4
Effects of IFN-α and AZT on HTLV-1 expression and cell growth of HTLV-1 infected cells. ILT-Hod and ILT-#29 cells (106/ml) were cultured in the absence or presence of IFN-α (3000 IU/ml) and/or AZT (10 μM) as indicated, and HTLV-1 expression (A), cell growth (B), cell cycle (C), and Ki-67 expression (D) in the cells were evaluated. A. Expression of intracellular Tax protein 3 days after the initiation of culture was evaluated by flow cytometry following stained with anti-Tax (open histogram) and isotype control (closed histogram) antibodies. B. ILT-Hod and ILT-#29 cells were similarly treated with IFN-α and/or AZT, and maintained with addition of equal volumes of fresh medium without IFN-α or AZT on the day 1 and 3, then viable (closed bar) and non-viable (open bar) cell numbers in cultures were evaluated by trypan blue exclusion on the day 8. *p < 0.05. C. ILT-Hod and ILT-#29 cells similarly treated with IFN-α and/or AZT were subjected to cell cycle analysis on the day 8. Cultures were treated with BrdU (10 μM) for the last 24 h of culture then permeabilized and incubated with a FITC-labeled mouse anti-BrdU antibody and 7AAD. Cells that are 7AAD-negative can be considered apoptotic (Apo). BrdU-negative and 7AAD-intermediate positive cells are in the G0/G1 phase. BrdU-positive and 7AAD-positive cells are in the S phase. BrdU-negative and 7AAD-highly positive cells are in the G2/M phase. The values in the dot plots indicate the proportion of the cells (%) in each phase. D. ILT-Hod and ILT-#29 cells similarly treated with IFN-α and/or AZT were analyzed for intracellular Ki-67 expression by flow cytometry on the day 8. The values in the dot plots indicate the proportion of Ki-67-positive cells (%).
Figure 5
Figure 5
Suppression of NF-κB activity by IFN-α in HTLV-1-infected cells. A. ILT-Hod and ILT-#29 cells that were infected with lentiviral vectors containing reporter gene for the NF-κB responsive element and the TK-promoter several weeks before, were treated with or without IFN-α (3000 IU/ml) and/or AZT (10 μM) for 4 days as indicated. Luciferase activities were measured, and relative NF-κB activities normalized to TK-promoter activities were indicated as means and SD of duplicate samples. *p < 0.05. B. The levels of mRNA of VEGF, a NF-κB-regulated gene, in ILT-Hod and ILT-#29 cells 3 days after incubation with (closed bar) or without (open bar) IFN-α (3000 IU/ml) were quantified by RT-PCR and standardized to GAPDH mRNA. The relative values are indicated as means and SD of duplicate samples. *p < 0.05.
Figure 6
Figure 6
Induction of p53-signaling by IFN-α and AZT in HTLV-1-infected cells. A. Intracellular phosphorylated p53 levels in ILT-Hod and ILT-#29 cells were evaluated by flow cytomertry 3 and 4 days after incubation, respectively, in the absence (black line) or presence of IFN-α (3000 IU/ml) alone (blue line), or IFN-α/AZT (10 μM) (red line). The closed histograms indicate cells stained with control antibody. B. ILT-Hod and ILT-#29 were treated with IFN-α and/or AZT for 4 days and mRNA expression of BAX (closed bar) and p21 (open bar) was evaluated by quantitative RT-PCR. Results are standardized with the copy number of GAPDH mRNA, and the relative values are indicated as means and SD of duplicate samples. *p < 0.05, **p ≤ 0.01. C. ILT-Hod and ILT-#29 cells were cultured with or without IFN-α/AZT in the presence or absence of a p53-inhibitor (Pifithrin-α p-Nitro Cyclic, 1 μM) for 3 days and 5 days, respectively, then the cells were analyzed for the cell cycle by flow cytometry following 7AAD-staining. The proportions of apoptotic cell fractions (pre G0/G1) were indicated below each histogram.

Similar articles

Cited by

References

    1. Hinuma Y, Nagata K, Hanaoka M, Nakai M, Matsumoto T, Kinoshita KI, Shirakawa S, Miyoshi I. Adult T-cell leukemia: antigen in an ATL cell line and detection of antibodies to the antigen in human sera. Proc Natl Acad Sci USA. 1981;78:6476–6480. doi: 10.1073/pnas.78.10.6476. - DOI - PMC - PubMed
    1. Uchiyama T, Yodoi J, Sagawa K, Takatsuki K, Uchino H. Adult T-cell leukemia: clinical and hematologic features of 16 cases. Blood. 1977;50:481–492. - PubMed
    1. Poiesz BJ, Ruscetti FW, Gazdar AF, Bunn PA, Minna JD, Gallo RC. Detection and isolation of type C retrovirus particles from fresh and cultured lymphocytes of a patient with cutaneous T-cell lymphoma. Proc Natl Acad Sci USA. 1980;77:7415–7419. doi: 10.1073/pnas.77.12.7415. - DOI - PMC - PubMed
    1. Gessain A, Barin F, Vernant JC, Gout O, Maurs L, Calender A, de The G. Antibodies to human T-lymphotropic virus type-I in patients with tropical spastic paraparesis. Lancet. 1985;2:407–410. - PubMed
    1. Osame M, Usuku K, Izumo S, Ijichi N, Amitani H, Igata A, Matsumoto M, Tara M. HTLV-I associated myelopathy, a new clinical entity. Lancet. 1986;1:1031–1032. - PubMed

Publication types