. 2013 Sep:62:99-107.
doi: 10.1016/j.yjmcc.2013.05.004. Epub 2013 May 17.

Sequencing of mRNA identifies re-expression of fetal splice variants in cardiac hypertrophy

Affiliations

Sequencing of mRNA identifies re-expression of fetal splice variants in cardiac hypertrophy

E G Ames et al. J Mol Cell Cardiol. 2013 Sep.

Abstract

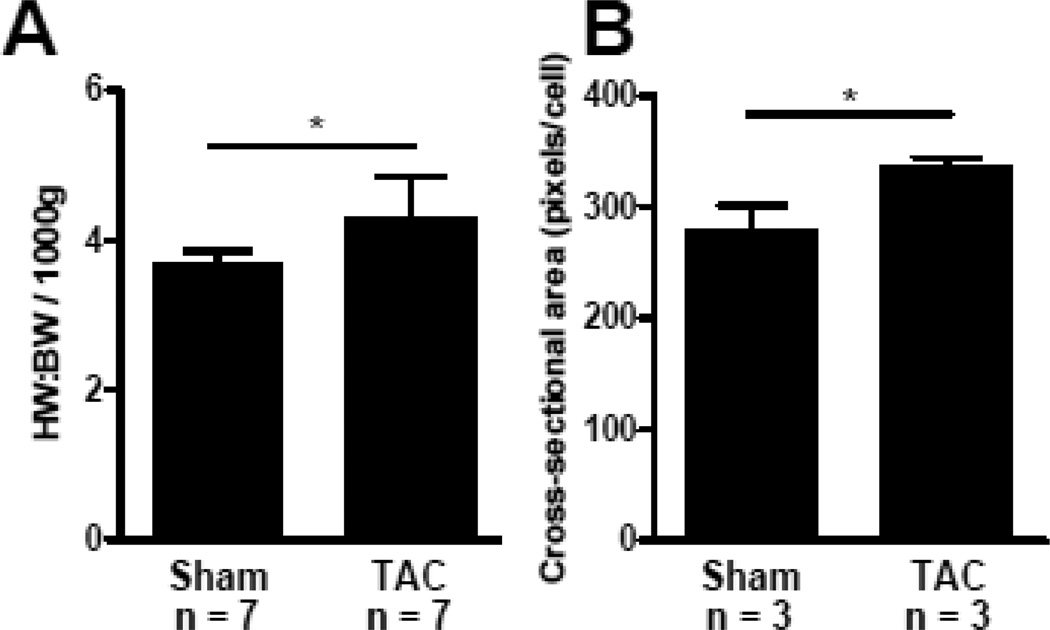
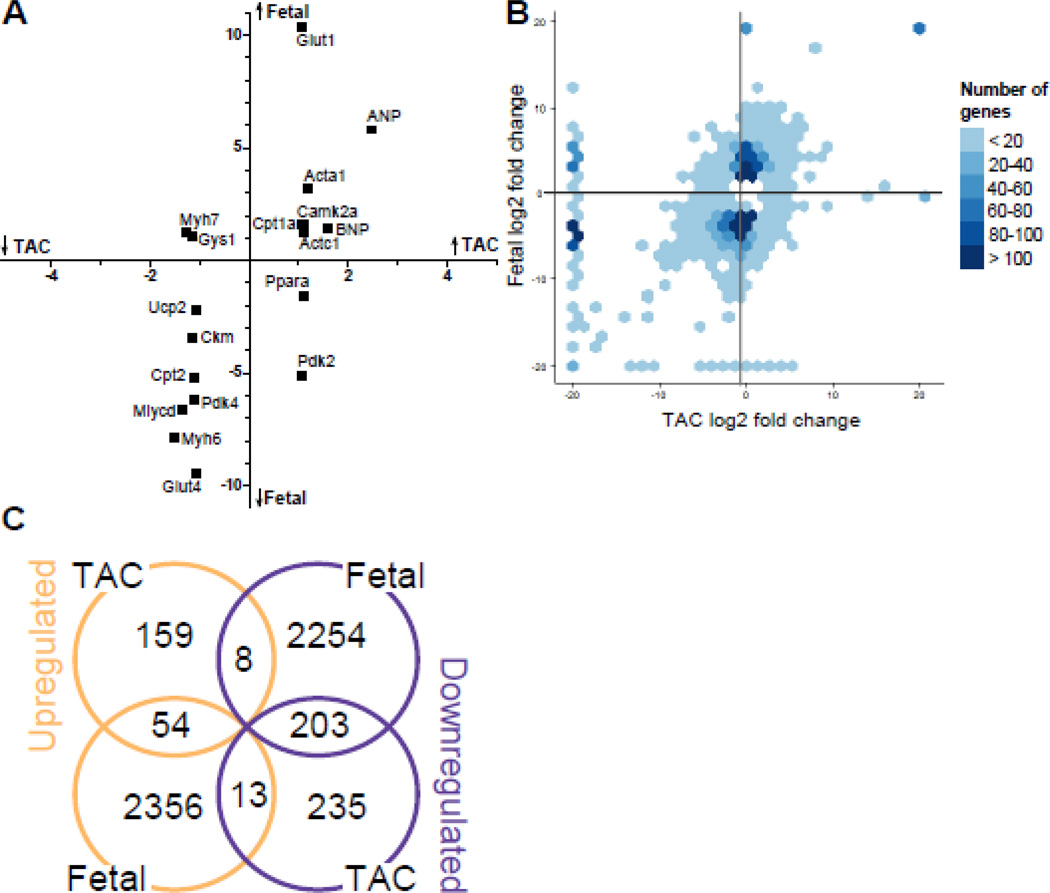
Cardiac hypertrophy has been well-characterized at the level of transcription. During cardiac hypertrophy, genes normally expressed primarily during fetal heart development are re-expressed, and this fetal gene program is believed to be a critical component of the hypertrophic process. Recently, alternative splicing of mRNA transcripts has been shown to be temporally regulated during heart development, leading us to consider whether fetal patterns of splicing also reappear during hypertrophy. We hypothesized that patterns of alternative splicing occurring during heart development are recapitulated during cardiac hypertrophy. Here we present a study of isoform expression during pressure-overload cardiac hypertrophy induced by 10 days of transverse aortic constriction (TAC) in rats and in developing fetal rat hearts compared to sham-operated adult rat hearts, using high-throughput sequencing of poly(A) tail mRNA. We find a striking degree of overlap between the isoforms expressed differentially in fetal and pressure-overloaded hearts compared to control: forty-four percent of the isoforms with significantly altered expression in TAC hearts are also expressed at significantly different levels in fetal hearts compared to control (P<0.001). The isoforms that are shared between hypertrophy and fetal heart development are significantly enriched for genes involved in cytoskeletal organization, RNA processing, developmental processes, and metabolic enzymes. Our data strongly support the concept that mRNA splicing patterns normally associated with heart development recur as part of the hypertrophic response to pressure overload. These findings suggest that cardiac hypertrophy shares post-transcriptional as well as transcriptional regulatory mechanisms with fetal heart development.

Keywords: Alternative splicing; Cardiac hypertrophy; Heart development; RNAseq.


Figures

Figure 1
Figure 1. Induction of hypertrophy with minimally-invasive approach to TAC
A, TAC rats had increased heart weight to body weight ratio per 1000 g of tissue compared to sham-operated rats 10 days after surgery. B, TAC cardiomyocytes had larger cross-sectional area compared to sham-operated cardiomyocytes (approximately 1000 cell measurements per animal). * indicates P < 0.05.
Figure 2
Figure 2. Comparison of gene expression changes during hypertrophy and heart Development
A, Scatterplot of known members of the fetal gene program. The x- and y-coordinates represent log2 fold changes of TAC and fetal groups relative to sham, respectively. B, Hexagonal histogram showing differential expression of significantly altered genes (absolute fold change > 1.5 and adjusted p-value < 0.05) relative to sham. C, Euler diagram showing overlap of differential gene expression between TAC and fetal samples compared to sham. Of the 221 significantly regulated genes in TAC, 54 were regulated in the same direction in the fetal samples, 8 in the opposite direction of fetal hearts, and 159 were upregulated only in TAC.
Figure 3
Figure 3. Changes in gene and isoform expression are distinct in both fetal and hypertrophic hearts
A, Each isoform expressed in the fetal or sham group above 3 FPKM is plotted as a gray dot, where the x-coordinate is the gene expression fold change relative to sham and the y-coordinate is the isoform fold change (relative to sham). Blue dots represent a transcript where both the isoform and gene expression are significantly different from sham (absolute fold change >1.5 and an adjusted p-value < 0.05). Red dots represent transcripts where only isoform expression is significantly altered. B, TAC gene and isoform expression plotted in a similar fashion as A.
Figure 4
Figure 4. Significant overlap of splicing patterns in heart development and hypertrophy
A, Overlap of changes in isoform expression between TAC and fetal samples compared to sham as shown in Euler diagram. Four hundred fifty-three transcripts are concordantly upregulated in both TAC and fetal hearts, while 934 isoforms are downregulated in both groups. B, The hexagonal histogram showing expression of each significant isoform (absolute fold change > 1.5 and an adjusted p-value < 0.05) relative to sham. C, Exon diagram of tropomyosin 3 (Tpm3) demonstrates multiple splicing patterns; a mutually exclusive exon (5a - red or 5b - blue) and three alternative terminal exons (TermA - green, TermB - purple, or TermC - yellow). D, The bar chart shows percentage of all Tpm3 transcripts that contain each splicing event based on band intensity from gel electrophoresis (n = 4). The expression of mutually exclusive exon 5a is statistically greater in both TAC and sham groups compared to the fetal group. In contrast, the expression of terminal exon Term A is significantly higher in sham than compared to both TAC and fetal groups, where * represents P <0.05.
Figure 5
Figure 5. Similarities and differences between isoform expression observed in fetal heart development and TAC
A, Top gene ontology term “cytoskeleton organization” (GO: 0007010) for isoforms that were commonly regulated in both TAC and fetal hearts. B, TAC-specific most significant gene ontology term “regulation of small GTPase-mediated signal transduction” (GO: 0051056). C, Fetal-specific most significant gene ontology term “cell cycle” (GO: 0007049). All significant isoforms of genes within a gene ontology cluster identified by DAVID (FPKM > 3, q-value < 0.05, and log2 fold change > 1.5) are plotted as a heat map to show similarities and differences between TAC and fetal isoform expression.Gene symbols of selected significant isoforms are listed above the heat map with lines drawn to the corresponding bar in the heat map. White dots within heat map bars denote statistical significance in isoform expression relative to sham.
Figure 6
Figure 6. Identification and validation of known developmental splicing events
A comparison of our fetal and sham groups identified 12 of 33 splicing events reported by Kalsotra et al. as significantly regulated in the same pattern in our data. PCR validation confirmed all 12 events are significantly different between E18 and adult hearts (n = 4 for each group and P < 0.05 for all events).

References

    1. Frey N, Olson EN. Cardiac hypertrophy: the good, the bad, and the ugly. Annu Rev Physiol. 2003;65:45–79. - PubMed
    1. Rajabi M, Kassiotis C, Razeghi P, Taegtmeyer H. Return to the fetal gene program protects the stressed heart: a strong hypothesis. Heart Fail Rev. 2007;12:331–343. - PubMed
    1. Izumo S, Nadal-Ginard B, Mahdavi V. Protooncogene induction and reprogramming of cardiac gene expression produced by pressure overload. Proc Natl Acad Sci USA. 1988;85:339–343. - PMC - PubMed
    1. Gorza L, Pauletto P, Pessina AC, Sartore S, Schiaffino S. Isomyosin distribution in normal and pressure-overloaded rat ventricular myocardium. An immunohistochemical study. Circ Res. 1981;49:1003–1009. - PubMed
    1. Mahdavi V, Lompre AM, Chambers AP, Nadal-Ginard B. Cardiac myosin heavy chain isozymic transitions during development and under pathological conditions are regulated at the level of mRNA availability. Eur Heart J. 1984;5(Suppl F):181–191. - PubMed

Publication types

Associated data