. 2013 Sep;12(9):2408-25.
doi: 10.1074/mcp.M112.017830. Epub 2013 May 20.

A combined approach of quantitative interaction proteomics and live-cell imaging reveals a regulatory role for endoplasmic reticulum (ER) reticulon homology proteins in peroxisome biogenesis

Affiliations

A combined approach of quantitative interaction proteomics and live-cell imaging reveals a regulatory role for endoplasmic reticulum (ER) reticulon homology proteins in peroxisome biogenesis

Christine David et al. Mol Cell Proteomics. 2013 Sep.

Abstract

Peroxisome biogenesis initiates at the endoplasmic reticulum (ER) and maturation allows for the formation of metabolically active organelles. Yet, peroxisomes can also multiply by growth and division. Several proteins, called peroxins, are known to participate in these processes but little is known about their organization to orchestrate peroxisome proliferation. Here, we demonstrate that regulation of peroxisome proliferation relies on the integrity of the tubular ER network. Using a dual track SILAC-based quantitative interaction proteomics approach, we established a comprehensive network of stable as well as transient interactions of the peroxin Pex30p, an integral membrane protein. Through association with merely ER resident proteins, in particular with proteins containing a reticulon homology domain, and with other peroxins, Pex30p designates peroxisome contact sites at ER subdomains. We show that Pex30p traffics through the ER and segregates in punctae to which peroxisomes specifically append, and we ascertain its transient interaction with all subunits of the COPI coatomer complex suggesting the involvement of a vesicle-mediated transport. We establish that the membrane protein Pex30p facilitates the connection of peroxisomes to the ER. Taken together, our data indicate that Pex30p-containing protein complexes act as focal points from which peroxisomes can form and that the tubular ER architecture organized by the reticulon homology proteins Rtn1p, Rtn2p and Yop1p controls this process.


Figures
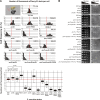
Fig. 1.
Fig. 1.
Pex30p and Pex11p act at different steps of peroxisome proliferation. A, Quantitative distribution of peroxisomes in yeast cells with various genetic backgrounds (as indicated) expressing mCherry-Px (red channel) as illustrated in a 3D model. Yeast cells were transformed with plasmids expressing PEX30 driven by the GAL promoter or GPD-controlled PEX11 or PEX25. The mutant cells PEX30ΔC expressed a truncated version of Pex30p lacking amino acids 375–523 from the PEX30 genomic locus. After galactose induction, cells were further incubated in medium containing oleic acid to induce peroxisome proliferation and observed 8 h later. For each yeast strain, fluorescent dots (mCherry-Px) were counted in three dimensions through a whole Z-stack in at least 100 cells from three independent cultures. The histograms illustrate the frequency distributions of cells (in percent) with a distinct number of peroxisomes. The average number of fluorescent mCherry-Px dots per cell is indicated as mean ± S.D. and tested for statistical significance (bottom panel). The dashed red lines represent the average number of peroxisomes in wild-type cells. B, Yeast cells with various genetic backgrounds, as indicated untransformed or transformed with plasmids expressing Pex11p, Pex25p, Pex30p or combinations, were grown to logarithmic phase in glucose medium and 10-fold serial dilutions were spotted onto solid medium containing either glucose or oleic acid. The function of peroxisomes was monitored through visualization of oleate use which led to the occurrence of transparency in the solid medium.
Fig. 2.
Fig. 2.
Dual-track SILAC-AP-MS analysis of Pex30p-containing membrane protein complexes. Isogenic yeast cells auxotrophic for arginine and lysine and expressing either native (control, heavy) or TAP-tagged (tagged, light) Pex30p were grown under peroxisome-proliferating conditions and labeled using SILAC. A, Affinity-purification after mixing (AP-AM). After harvest, SILAC labeled cells were mixed in equal ratio and Pex30p complexes were affinity-purified from solubilized membrane fractions followed by quantitative MS analysis. Specific binding partners consistently showed high SILAC ratios, whereas proteins with ratios of approximately one were considered copurified contaminants. Proteins were plotted according to their p values (-log10) against the mean log10 SILAC ratios determined in three independent repeats. Specific binding partners illustrated in black and colored dots exhibit p values of ≤ 0.05 and mean log10 ratios “light-to-heavy” of ≥ 0.66 when quantified in 3/3 replicates and ≥ 1.66 in 2/3 replicates. The core components of Pex30p complexes are indicated. B, Affinity-purification prior to mixing (AP-PM). SILAC AP-PM experiments were performed to allow for identification of stable and transient interaction partners by quantitative MS. In addition to the bait and core components, specific transient binding partners also exhibited high SILAC ratios, whereas copurified contaminant showed ratios of approximately one. To define the interactomes of Pex30p, proteins were plotted according to their p values (-log10) versus the mean log10 SILAC ratios determined in triplicate experiments. Specific binding partners of Pex30p exhibit p values of ≤ 0.05 and mean log10 ratios “light-to-heavy” of ≥ 1.10 when quantified in 3/3 replicates and ≥ 2.79 in 2/3 replicates. Specific components of Pex30p complexes are labeled in black; red indicates peroxins involved in peroxisome proliferation, green ER proteins, blue subunits of the COPI coatomer complex.
Fig. 3.
Fig. 3.
Pex30p specifically associates with the COPI coatomer complex. A, Specific association between COPI components and Pex30p are exemplified by zoom-in MS survey spectra of SILAC-encoded peptides. B, Affinity purification of COPI components. Cells expressing TAP-tagged subunits of the coatomer complex or Pex14p-TAP, a subunit of the peroxisomal importomer, were used for affinity purifications using IgG-coupled Sepharose beads. After washing, the Sepharose was split into two equal parts and proteins bound to the matrix were eluted via TEV protease digestion (TEV) or using SDS sample buffer (SDS). Whole cell lysates (Input) and the respective eluates were analyzed by immunoblotting with anti-Protein A, anti-Pex30p, anti-COPI or anti-Porin antibodies. Signals for the TAP-tagged COPI subunits show slower electrophoretic mobility in the input lanes because of the Protein A repeats (white arrowheads) but not in the TEV eluates. C, SILAC-based AP-PM experiments for Pex29p-containing membrane protein complexes. Isogenic yeast cells auxotrophic for lysine and arginine were used and three independent repeats were performed. Proteins are plotted by their p values (-log10) against the mean log10 SILAC ratios determined in AP-PM experiments (n = 3). Specific binding partners of Pex29p exhibit p values of ≤ 0.05 and mean log10 ratios “light-to-heavy” ≥ 0.75 and ≥ 1.89 when quantified in 3/3 and 2/3 replicates, respectively. Reticulon homology proteins and Sey1p are indicated in green. Four subunits of the COPI vesicle coatomer were found to transiently associate with Pex29p (indicated in blue).
Fig. 4.
Fig. 4.
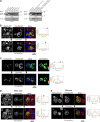
Pex30p accumulates at subdomains of the cortical ER in patches that coincide with Rtn1p. A, Varying Pex29p levels affect the interaction between Rtn1p and Pex30p. Yeast cells with various genetic backgrounds (as indicated) expressing TAP-tagged Rtn1p (Rtn1pTAP) from their genomic locus were used for affinity-purification. Equal amounts of proteins from digitonin-solubilized membranes (Inputs) and supernatants from fractions treated with TEV protease (Eluates) were analyzed by immunoblotting using anti-Pex30p antibodies. The levels of Rtn1TAP detected in the input fractions serve as loading control. In the last two lanes of the right panel, wild-type cells contained multicopy plasmids expressing PEX29 either controlled by the ADH1- or the endogenous PEX29-promoter. B, Pex30p localizes to the ER. pex30Δ cells expressing plasmid-borne Sec63p-RFP (red channel) and Pex30p-GFP (green channel) controlled by the GAL-promoter were treated as described in Fig. 1. A region of interest was chosen to illustrate through line profiling that the large Pex30p-GFP accumulations (green punctae), although partially colocalizing, did not coincide with accumulations of Sec63p-RFP (see arrow, dashed lines, and profiles). The blue color depicts the cell wall obtained from transmission images. C, Peroxisomes accumulate near Pex30p-GFP punctae. Mutant pex30Δ cells expressing the peroxisomal marker protein mCherry-Px (red channel) and plasmid-borne Pex30p-GFP (green channel) were cultured as described in Fig. 1. Colocalization was analyzed for the indicated cells as depicted in the color-coded maps for spatial discrimination. A region of interest was chosen to illustrate through line profiling the high fluorescent signal of Pex30p-GFP accumulations (green punctae) in comparison with accumulations of mCherry-Px punctate signal. Correlation between peroxisomes and Pex30p is indicated (arrowheads). D, Pex30p-GFP colocalizes with Rtn1p-mCherry in the ER. Cells expressed Rtn1p-mCherry (red channel) from the RTN1 genomic locus and plasmid-borne Pex30p-GFP (green channel). The perinuclear ER contained less Rtn1p-mCherry signal (arrow). Line profiles were established for chosen regions of the cortical ER in which both Rtn1p-mCherry and Pex30p-GFP accumulated in large punctate structures (arrowheads). E, In contrast, in cells grown on glucose-containing medium, Pex30p-GFP does not seem to accumulate in large punctate structures. On either growth conditions, the Rtn1p-mCherry stainings were indistinguishable (D, E).
Fig. 5.
Fig. 5.
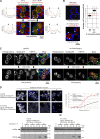
The cortical ER and reticulon homology proteins control de novo biogenesis of peroxisomes. A, Overproduction of Rtn1p alters the distribution of Pex30p-GFP. Mutant cells rtn1Δ (left panel) and rtn1Δ with plasmid-encoded Rtn1p (right panel) expressing Yop1p-mCherry (red channel) from the YOP1 genomic locus were transformed with plasmids coding for Pex30p-GFP (green channel). Cells were treated as described in Fig. 1. The arrows point to the accumulation of both Yop1p-mCherry and Pex30p-GFP in punctate structures in cells lacking Rtn1p. Colocalization of these structures is illustrated through line profiling of a region of interest (arrowheads). In contrast, in cells overexpressing Rtn1p the Pex30p-GFP fluorescent signal was present throughout the ER without major accumulations as illustrated in the line profiles (arrows). Line scans illustrate that with or without Rtn1p the Yop1-mCherry stainings show accumulations. B, Cells lacking RHPs contain an elevated number of peroxisomes. Wild-type cells and cells lacking Rtn1p, Rtn2p and Yop1p were treated as described in Fig. 1 and images were acquired for mCherry-Px (red channel). Note the tendency of peroxisomes to cluster in the mutant cells (arrowheads). The average number of fluorescent mCherry-Px dots per cell is indicated as mean ± S.D. (right panel). The dashed red line represents the average number of peroxisomes in wild-type cells. C, Localization of Pex30p-mCherry with respect to Sec63p-GFP (ER) and BFP-Px (peroxisomes) in cells lacking Pex30p or the RHPs (as indicated). D, Peroxisome biogenesis in cells lacking RHPs. Peroxisome biogenesis was monitored through expression of GAL-driven PEX3 in control cells or in cells lacking the RHPs chromosomally expressing mCherry-Px as indicated. The graph shows the percentage of cells containing peroxisomes in dependence of the incubation time in galactose medium. Protein extracts were analyzed by immunoblotting for the indicated time points (D, Dextrose; G, Galactose). Equal amounts of proteins were loaded in each lane. After protein transfer onto nitrocellulose, the membrane was cut in two parts; the upper part was probed with anti-Kar2p (Kar2p, 74.4 kDa) and the lower part with anti-Pex3p (Pex3p, 50.6 kDa) antibodies.
Fig. 6.
Fig. 6.
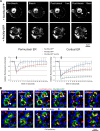
Pex30p traffics through the ER and peroxisomes adhere to Pex30p patches at ER subdomains. A, FRAP experiments in pex30Δ yeast cells expressing either Sec63p-GFP or Pex30p-GFP (green channel). Small regions of the perinuclear or cortical ER fluorescence were bleached as indicated and fluorescence recovery was monitored (closed arrowhead, upper panel). For Pex30p-GFP, three regions were chosen for bleaching as indicated and fluorescence recovery was monitored within the perinuclear and the cortical ER (closed arrowheads) as well as in a fluorescent dot at the cell periphery (open arrowhead). The images show representative experiments. Quantifications of fluorescence intensities from at least five independent experiments are illustrated for each studied region. Error bars represent the standard error. B, Dynamics of Pex30p-GFP in growing cells. The fluorescence emitted by mCherry-Px (red channel) and Pex30p-GFP (green channel) was monitored live starting 3 h after plating the cells on agarose pads containing oleic acid. A portion of the mCherry-Px signal gathered to the Pex30p-GFP accumulations forming at later time points (closed arrowheads) and at the bud tip (open arrowhead).
Fig. 7.
Fig. 7.
Peroxisome diffusion and targeted movement decrease in the absence of Pex30p. A, Mutant pex30Δ cells expressing either mCherry-Px (red channel) only or plasmid-borne Pex30p-GFP (green channel) in addition were imaged in 60 s intervals. Representative trajectories of peroxisomes (mCherry-Px dots) are shown in a pex30Δ cell (#1) and in a pex30Δ cell expressing Pex30p-GFP (#2 and #3). Trajectory #2 corresponds to a mobile peroxisome, whereas trajectory #3 remained close to the depicted Pex30p-GFP puncta (#4). Cell walls are shown based on transmission images (blue color). B, Analysis of the peroxisomal trajectories (#1–3) shown in (A) for two different parameters: the mean square displacement (MSD, upper plot) allows for the calculation of the diffusion coefficients (D2). The slopes of the corresponding moment scaling spectra (MSS, lower plot) help discriminating the type of motion. C, Scatter plot summarizing all peroxisomal trajectories studied. The plot shows the diffusion coefficients (D2) extracted from the MSD diagram in function of the slope extracted from the MSS (SMSS). The trajectories of all peroxisomes are indicated for pex30Δ mutant cells (blue circles; n = 251), pex30Δ expressing Pex30p-GFP (red crosses; n = 108), rtn1Δrtn2Δyop1Δ cells (green crosses; n = 327) and for pex30Δrtn1Δrtn2Δyop1Δ (gray triangles; n = 197). For each strain studied, trajectories derived from measurements of all visible peroxisomes (mCherry-Px dots; n indicated) in more than 10 cells. For each peroxisomal population a two-dimensional box plot was overlaid and the statistical significance in both SMSS and D2 for cells with or without Pex30p (red and green versus blue and gray data) was assessed using a Wilcoxon rank sum test as indicated under “Experimental Procedures” (p < 0.05).
Fig. 8.
Fig. 8.
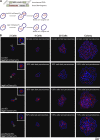
De novo biogenesis of peroxisomes is enhanced in cells lacking Pex30p. A, Cartoon showing the retention of peroxisomes in the mother cell in mutants lacking Inp2p. In wild-type cells, the number of peroxisomes doubles shortly before cell division and both mother and daughter inherit half of the peroxisome pool. In the absence of Inp2p, all peroxisomes are retained in the mother cell upon cell division. Peroxisomes are slowly regenerated de novo in daughter cells. B, Peroxisomal biogenesis assay in inheritance mutant cells. Cells expressing mCherry-Px were plated onto agarose pads containing glucose medium and the formation of microcolonies originating from single cells were observed live for a total of 12 h in 15 min intervals. The experiments were performed on three independent cultures. Each time, eight single cells were imaged simultaneously, one example of which is shown for each strain as indicated. Note that cells lacking Pex30p or Pex29p and Pex30p contain many peroxisomes. The arrowheads indicate mother cells.

References

    1. Wanders R. J., Waterham H. R. (2006) Biochemistry of mammalian peroxisomes revisited. Annu. Rev. Biochem. 75, 295–332 - PubMed
    1. Faust P. L., Kaye E. M., Powers J. M. (2010) Myelin lesions associated with lysosomal and peroxisomal disorders. Expert Rev. Neurother. 10, 1449–1466 - PubMed
    1. Fan J., Quan S., Orth T., Awai C., Chory J., Hu J. (2005) The Arabidopsis PEX12 gene is required for peroxisome biogenesis and is essential for development. Plant Physiol. 139, 231–239 - PMC - PubMed
    1. Steinberg S. J., Dodt G., Raymond G. V., Braverman N. E., Moser A. B., Moser H. W. (2006) Peroxisome biogenesis disorders. Biochim. Biophys. Acta 1763, 1733–1748 - PubMed
    1. Distel B., Erdmann R., Gould S. J., Blobel G., Crane D. I., Cregg J. M., Dodt G., Fujiki Y., Goodman J. M., Just W. W., Kiel J. A., Kunau W. H., Lazarow P. B., Mannaerts G. P., Moser H. W., Osumi T., Rachubinski R. A., Roscher A., Subramani S., Tabak H. F., Tsukamoto T., Valle D., van der Klei I., van Veldhoven P. P., Veenhuis M. (1996) A unified nomenclature for peroxisome biogenesis factors. J. Cell Biol. 135, 1–3 - PMC - PubMed

Publication types

LinkOut - more resources