. 2013 Jul 5;288(27):19882-99.
doi: 10.1074/jbc.M113.473181. Epub 2013 May 20.

Single cell analysis of RNA-mediated histone H3.3 recruitment to a cytomegalovirus promoter-regulated transcription site

Affiliations

Single cell analysis of RNA-mediated histone H3.3 recruitment to a cytomegalovirus promoter-regulated transcription site

Alyshia Newhart et al. J Biol Chem. .

Abstract

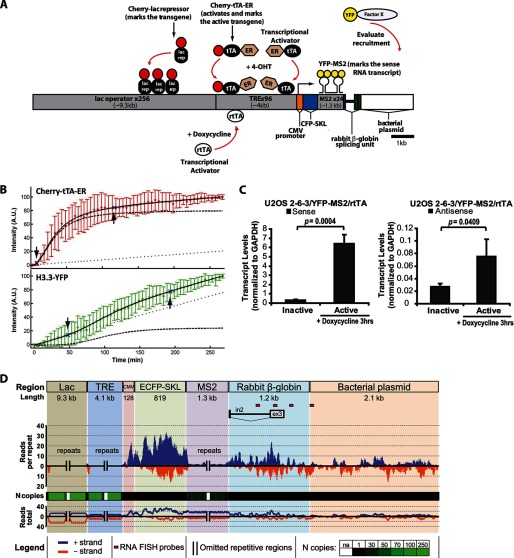
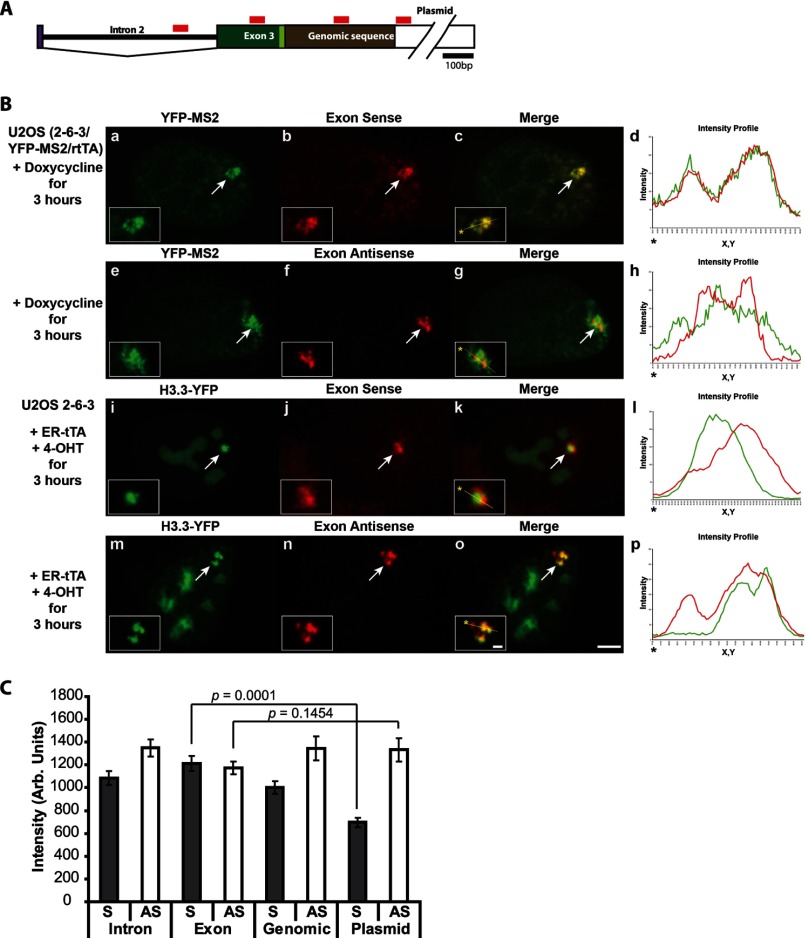
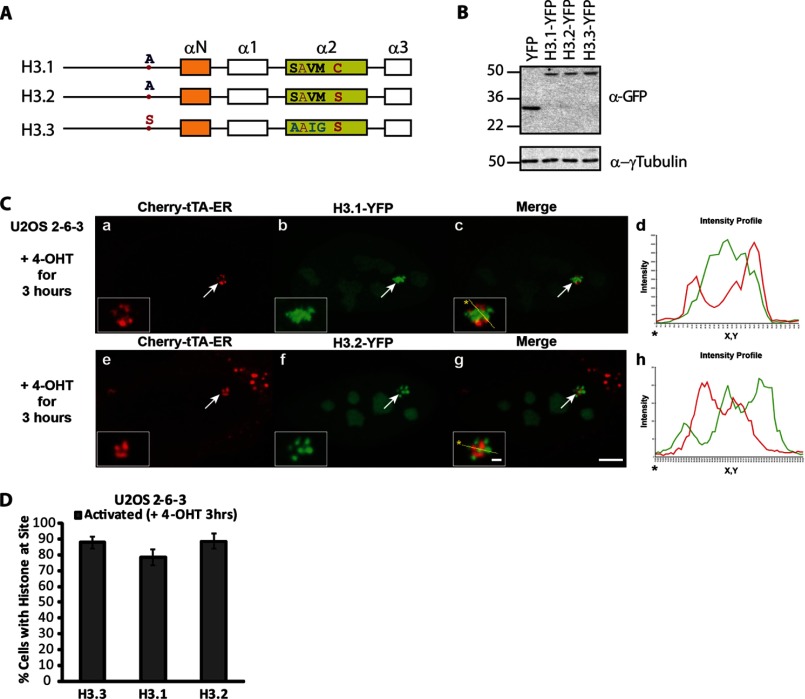
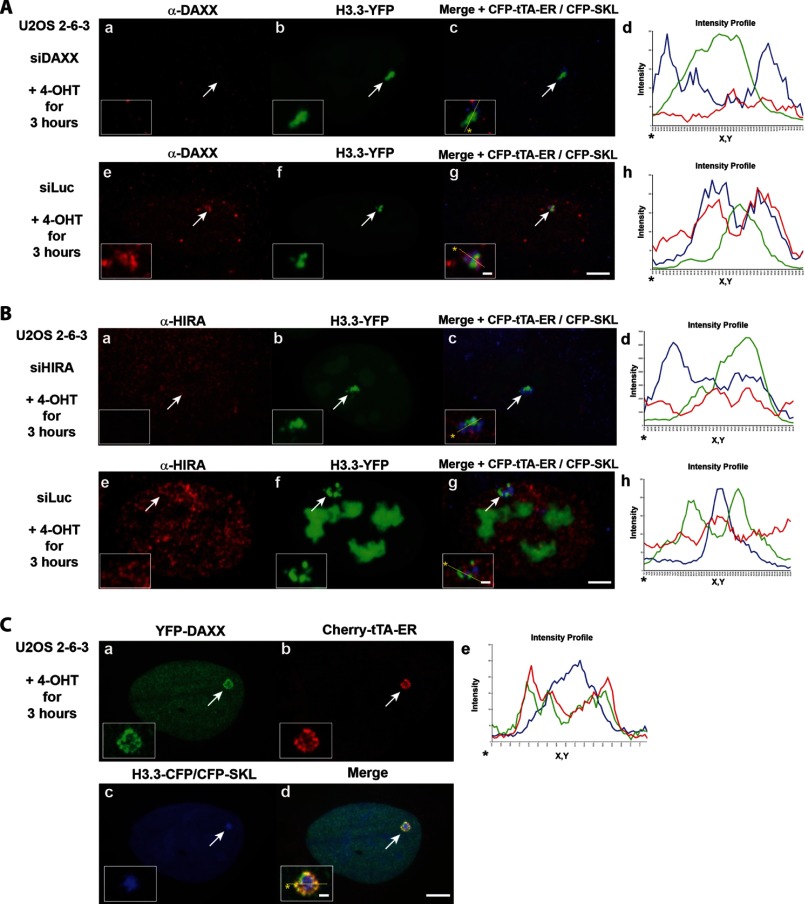
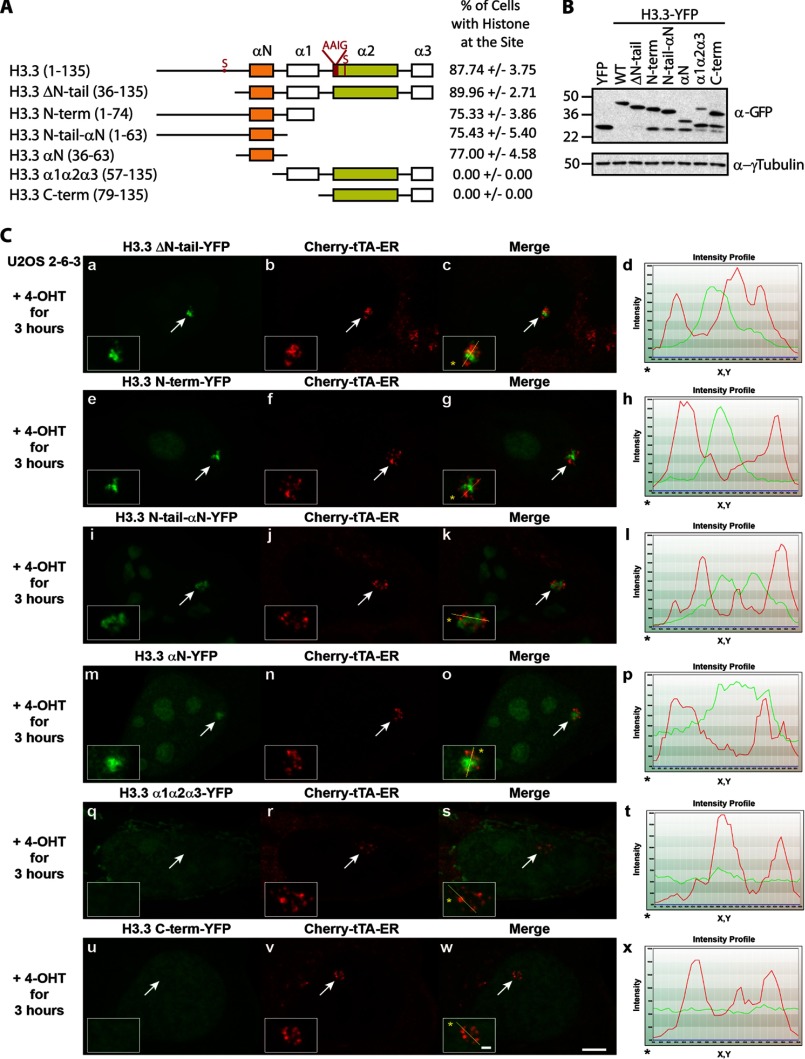
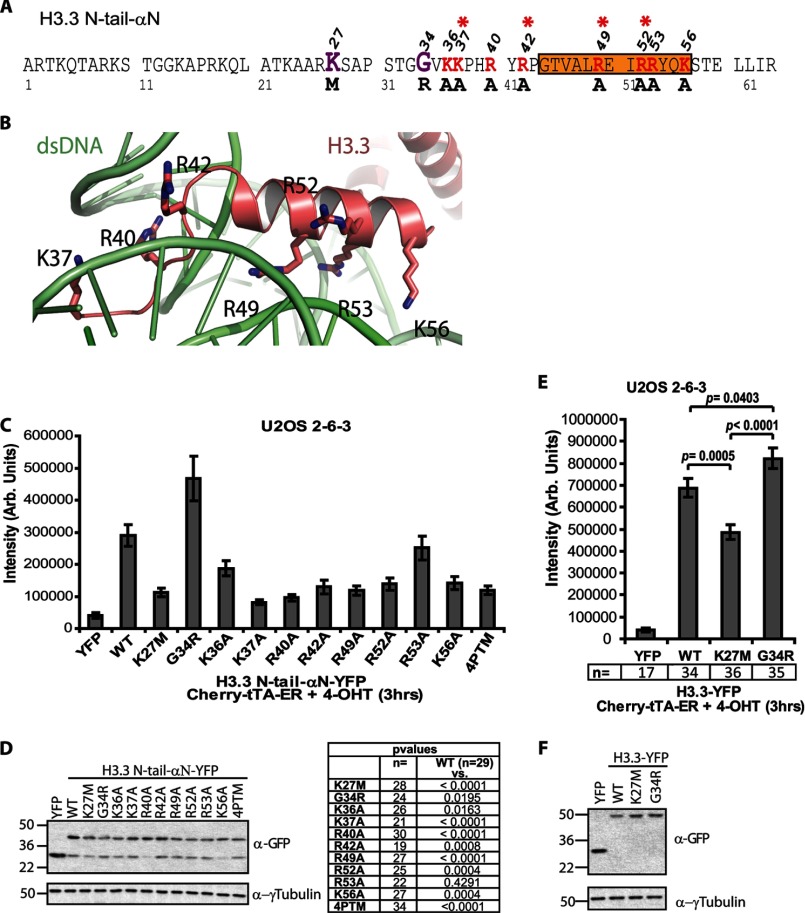
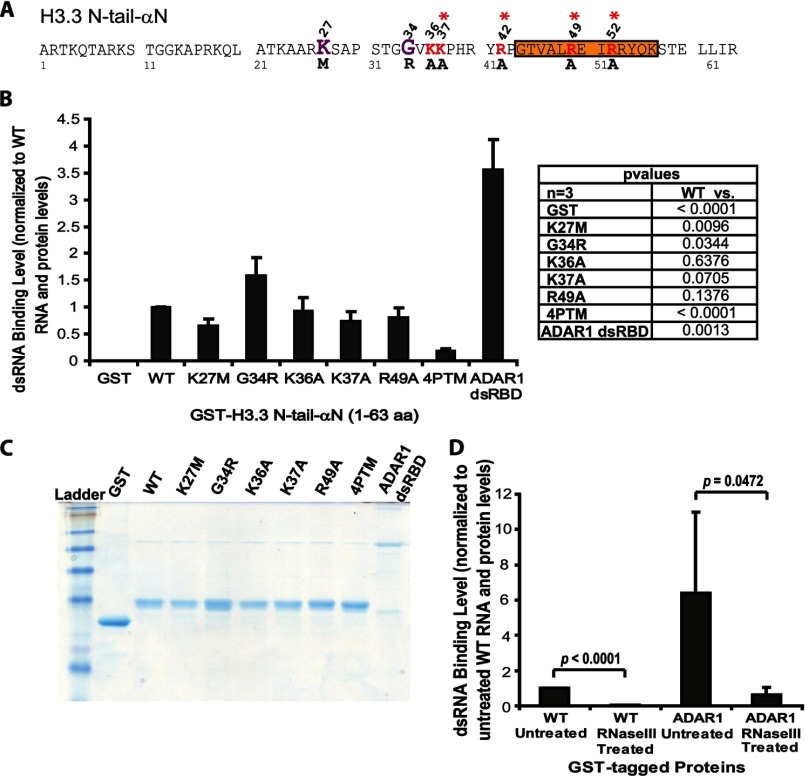
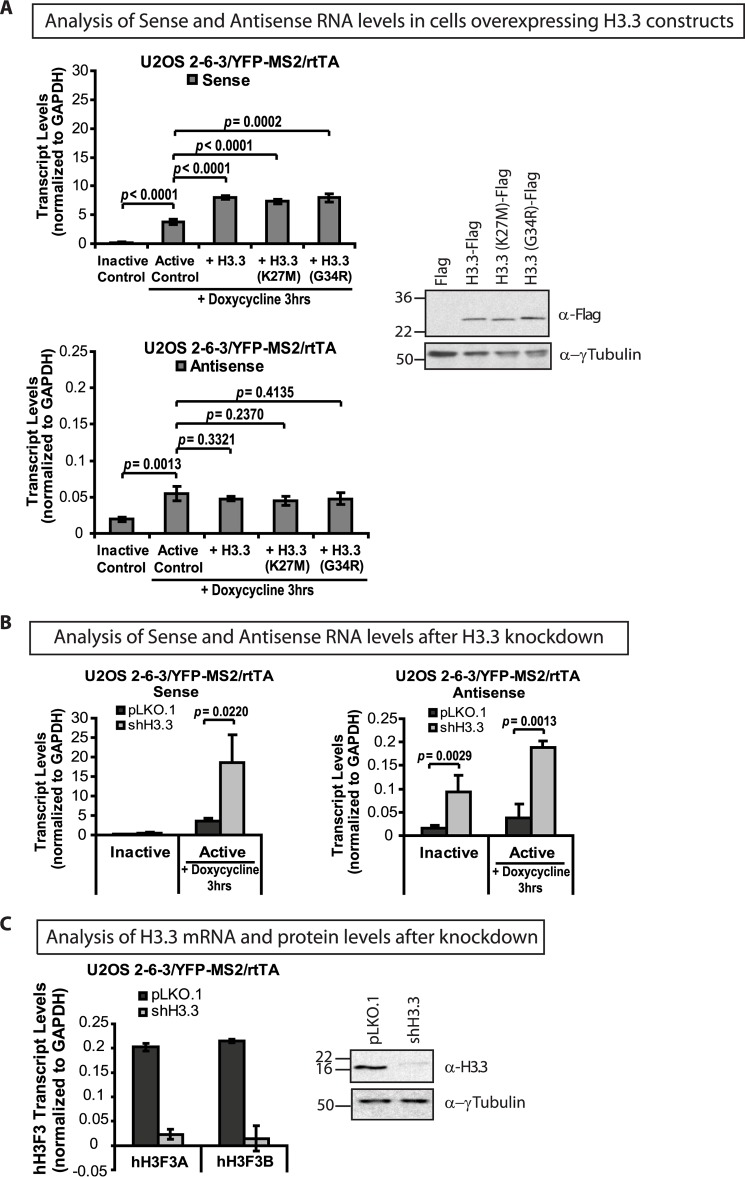
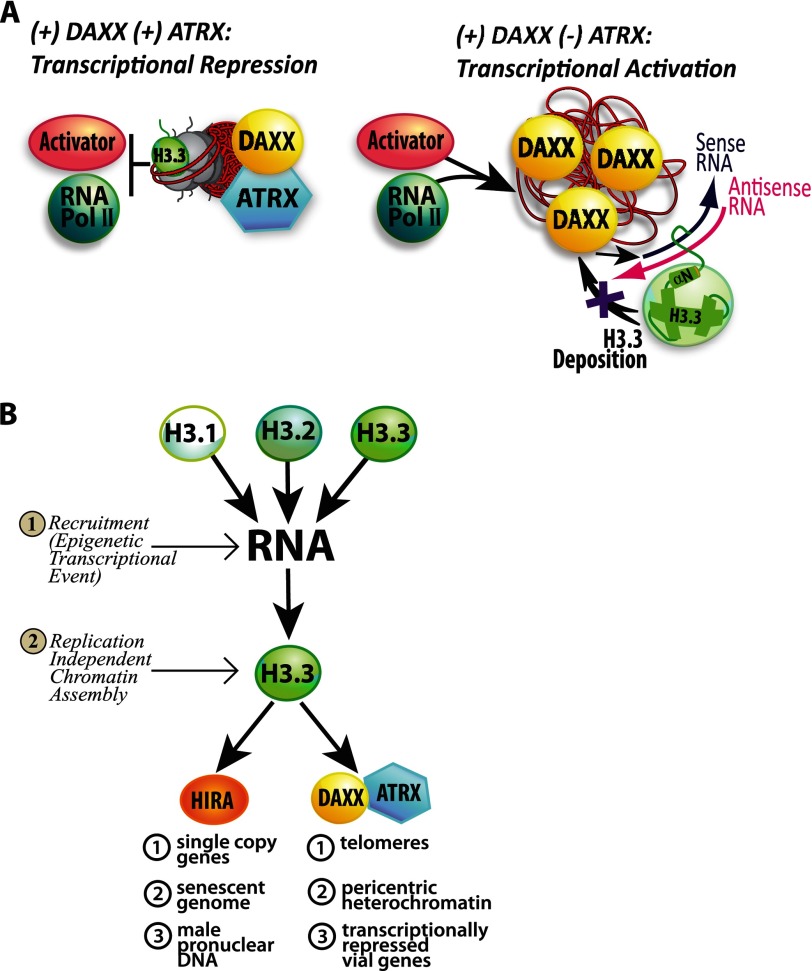
Unlike the core histones, which are incorporated into nucleosomes concomitant with DNA replication, histone H3.3 is synthesized throughout the cell cycle and utilized for replication-independent (RI) chromatin assembly. The RI incorporation of H3.3 into nucleosomes is highly conserved and occurs at both euchromatin and heterochromatin. However, neither the mechanism of H3.3 recruitment nor its essential function is well understood. Several different chaperones regulate H3.3 assembly at distinct sites. The H3.3 chaperone, Daxx, and the chromatin-remodeling factor, ATRX, are required for H3.3 incorporation and heterochromatic silencing at telomeres, pericentromeres, and the cytomegalovirus (CMV) promoter. By evaluating H3.3 dynamics at a CMV promoter-regulated transcription site in a genetic background in which RI chromatin assembly is blocked, we have been able to decipher the regulatory events upstream of RI nucleosomal deposition. We find that at the activated transcription site, H3.3 accumulates with sense and antisense RNA, suggesting that it is recruited through an RNA-mediated mechanism. Sense and antisense transcription also increases after H3.3 knockdown, suggesting that the RNA signal is amplified when chromatin assembly is blocked and attenuated by nucleosomal deposition. Additionally, we find that H3.3 is still recruited after Daxx knockdown, supporting a chaperone-independent recruitment mechanism. Sequences in the H3.3 N-terminal tail and αN helix mediate both its recruitment to RNA at the activated transcription site and its interaction with double-stranded RNA in vitro. Interestingly, the H3.3 gain-of-function pediatric glioblastoma mutations, G34R and K27M, differentially affect H3.3 affinity in these assays, suggesting that disruption of an RNA-mediated regulatory event could drive malignant transformation.

Keywords: Antisense RNA; Chromatin Regulation; Chromatin Remodeling; Gene Expression; Gene Regulation; Gene Silencing; Microscopy; Nuclear Organization; RNA; Transcription.


Figures

FIGURE 1.
FIGURE 1.
Sense and antisense RNA is transcribed from the CMV promoter-regulated transgene in the ATRX-null U2OS cell line. A, diagram of the inducible transgene drawn to scale. Expression of the Cherry-lac repressor allows the transgene array to be visualized. Transcription is induced from the minimal CMV promoter by the activators Cherry-tTA-ER and ER-tTA in the presence of 4-hydroxytamoxifen (4-OHT) and rtTA in the presence of doxycycline (Dox). The transcribed RNA encodes CFP fused to a peroxisomal targeting signal (SKL). The RNA is visualized by YFP-MS2, which binds to the stem loops in the transcript. The 3′-end of the transcription unit is composed of the intron 2 splicing unit from the rabbit β-globin gene. The recruitment of YFP-tagged factors to the array can be monitored by co-expression with an array-binding protein. B, quantification of Cherry-tTA-ER (red) and H3.3-YFP (green) recruitment to the transgene array during activation in single cells. 4-Hydroxytamoxifen was added immediately after the first time point (∼0 min). Images were collected every 5 min for 4.5 h. Measured intensities were normalized to the high and low plateau values and fitted to a model (solid black line) containing logistic (dashed lines) and linear (dotted lines) parameters. The initial accumulation (downward pointing arrow) is the point when the logistic component of the curve deviates 5% from the initial base line. The end of rapid accumulation (upward pointing arrow) is the point when the logistic component reaches 95% of the final base line. The graph is the average of 13 independent cells. Error bars, S.D. Supplemental Movie 1 shows a representative time series. Table 1 summarizes the logistical and linear parameter values used in the equation to calculate intensity. C, strand-specific qRT-PCR analysis of total RNA collected from U2OS 2-6-3/YFP-MS2/rtTA cells 0 and 3 h after activation with doxycycline using a primer pair located in rabbit β-globin exon 3. Results are the average of at least three independent experiments. S.D. values, in the form of error bars, and p values, calculated using unpaired Student's t test, are presented in the graphs. D, strand-specific high throughput sequencing analysis of nuclear RNA isolated from 2-6-3/YFP-MS2/rtTA cells 3 h after activation with doxycycline. The upper bar depicts the structure of the transgene. Relative levels for sense (blue) and antisense (orange) transgene expression tags are shown below it. The black and green bar plot indicates the number of unique aligned sequencing reads across the transgene normalized by the number of repeated copies in the transgene segments. The heat map is color-coded for black to indicate the unique sequence regions; the green intensity is proportional to the repeat copy number in the transgene. The line plot at the bottom represents unnormalized data. Red rectangles below the transgene show the location of the strand-specific RNA FISH probes used in Fig. 2A.
FIGURE 2.
FIGURE 2.
H3.3 is recruited to sense and antisense RNA at the activated transgene array in U2OS cells. A, diagram of the 3′-end of the transcription unit (Fig. 1A) showing the locations of the strand-specific RNA FISH probes. B, localization of the exon sense (a–d) and exon antisense (e–h) RNA FISH probes at the activated array in relation to YFP-MS2. Shown is localization of the exon sense (i–l) and exon antisense (m–p) RNA FISH probes at activated arrays in relation to H3.3-YFP. Yellow lines in enlarged merge insets show the path through which the red and green intensities were measured in the intensity profiles (d, h, l, and p). Asterisks mark the start of the measured lines. Scale bar, 5 μm. Scale bar in enlarged inset, 1 μm. C, quantitative image analysis of S and AS RNA levels using the probes shown in A at arrays activated for 3 h. Error bars, S.E. p values, calculated using unpaired t test, are presented in the graphs. n values are as follows: intron, S, n = 19; AS, n = 26; exon, S, n = 21; AS, n = 27; genomic, S, n = 18; AS = 19; plasmid, S, n = 17; AS, n = 15.
FIGURE 3.
FIGURE 3.
H3.1, H3.2, and H3.3 are all strongly recruited to the activated transgene array in U2OS cells. A, diagram of the domain structure of the H3 variants showing the locations of the amino acid differences between them. B, Western blot analysis of the YFP-tagged H3 variants using a GFP antibody. γ-Tubulin is used as a loading control. C, localization of H3.1-YFP (a–d) and H3.2-YFP (e–h) at the activated transgene array in relation to the activator, Cherry-tTA-ER. Yellow lines in the enlarged merge insets show the path through which the red and green intensities were measured in the intensity profiles (d and h). Asterisks mark the start of the measured line. Scale bar, 5 μm. Scale bars in enlarged inset, 1 μm. D, percentage of cells in which the histone H3 variants were recruited to the activated transgene array. 100 cells were counted in three independent experiments. S.D. values in the form of error bars are shown in the graph.
FIGURE 4.
FIGURE 4.
H3.3 recruitment to the activated array in U2OS cells is chaperone-independent. A, H3.3-YFP recruitment to the CFP-tTA-ER-activated array in Daxx (a–d) and control (e–g) siRNA-treated cells. Daxx levels were assessed by imaging immunofluorescently labeled cells using the exact same settings. B, H3.3-YFP recruitment to the CFP-tTA-ER-activated array in control (a–d) and (e–g) HIRA siRNA-treated cells. HIRA levels were assessed by imaging immunofluorescently labeled cells using the exact same settings. C, localization of YFP-Daxx (a), Cherry-tTA-ER (b), and H3.3-CFP/CFP-SKL (c) in activated cells. Yellow lines in enlarged merge insets show the path through which the red, green, and blue intensities were measured in the intensity profiles (A and B, d and h; C, e). Asterisks mark the start of the measured lines. Scale bar, 5 μm. Scale bar in enlarged inset, 1 μm.
FIGURE 5.
FIGURE 5.
H3 N-tail amino acids and helix αN mediate H3.3 recruitment to the activated transgene array in U2OS cells. A, diagram of YFP-tagged H3.3 deletion constructs. Percentage of cells in which the H3.3 deletion constructs are recruited to the activated transgene array in U2OS cells. 100 cells were counted in three independent experiments. S.D. values are shown. B, Western blot analysis of the YFP-tagged H3.3 deletion constructs using a GFP antibody. γ-Tubulin is used as a loading control. C, localization of YFP-tagged H3.3 deletion constructs at the activated transgene array in relation to the activator, Cherry-tTA-ER. Yellow lines in enlarged merge insets show the path through which the red and green intensities were measured in the intensity profiles (d, h, l, p, t, and x). Asterisks mark the start of the measured line. Scale bar, 5 μm. Scale bars in enlarged inset, 1 μm.
FIGURE 6.
FIGURE 6.
Quantitative single-cell image analysis of H3.3 recruitment to the activated transgene array in U2OS cells. A, diagram of the amino acid sequence of the H3.3 N-tail-αN construct showing the locations of the point mutations analyzed in the single-cell recruitment assay. The locations of the pediatric glioblastoma driver mutations, K27M and G34R, are shown in purple. The amino acids converted to alanine are shown in red. Asterisks mark the amino acids mutated in the four-point mutant (4PTM) construct. Orange shading demarcates the αN helix. B, crystal structure of histone H3 from amino acids 37–60 (salmon) in relation to dsDNA (green) in the nucleosome (Protein Data Bank code 3LJA). The lysine and arginine residues changed to alanine are numbered. C, quantitative single-cell image analysis of the total intensity of the YFP-tagged H3.3 N-tail-αN constructs at the activated transgene array. Error bars, S.E. n and p values, calculated using unpaired t test, are presented in the chart below. D, Western blot analysis of the YFP-tagged H3.3 N-tail-αN constructs using a GFP antibody. Tubulin is used as a loading control. E, quantitative single-cell image analysis of the total intensity of the YFP-tagged H3.3 constructs at the activated transgene array. Error bars, S.E. n values are presented below the graph, and p values, calculated using unpaired t test, are presented in the graph. F, Western blot analysis of full-length YFP-tagged H3.3 constructs using a GFP antibody. Tubulin is used as a loading control.
FIGURE 7.
FIGURE 7.
H3.3 N-tail-αN binds to double-stranded RNA in vitro. A, diagram of the amino acid sequence of the H3.3 N-tail-αN region showing the locations of the point mutations analyzed in the in vitro dsRNA binding assay. The location of the pediatric glioblastoma driver mutations, K27M and G34R, are shown in purple. The amino acids converted to alanine are shown in red. Asterisks mark the amino acids mutated in the four-point mutant (4PTM) construct. Orange shading demarcates the αN helix. B, measurement of dsRNA binding levels in the in vitro assay normalized to wild-type (WT) H3.3 N-tail-αN RNA and protein levels. GST is the negative control, and the ADAR1 dsRBD is the positive control. S.D. values, in the form of error bars, are presented in the graphs. p values, calculated using unpaired t test, are presented in the chart. C, Coomassie-stained gel of the purified bacterially expressed GST fusion proteins used in the binding assay. D, analysis of RNase III-treated WT H3.3 N-tail-αN and ADAR1 dsRBD-bound RNA normalized to WT RNA and protein levels. S.D. values, in the form of error bars, and p values, calculated using unpaired t test, are presented in the graphs.
FIGURE 8.
FIGURE 8.
H3.3 regulates transcription at the CMV promoter-regulated transgene array. A, strand-specific qRT-PCR analysis of total RNA collected from U2OS 2-6-3/YFP-MS2/rtTA cells expressing full-length FLAG-tagged H3.3 constructs 0 and 3 h after activation with doxycycline (Dox) using a primer pair in rabbit β-globin exon 3. Results are the average of at least three independent experiments. S.D. values, in the form of error bars, and p values, calculated using unpaired t test, are presented in the graphs. Western blot analysis of FLAG-tagged H3.3 constructs using the FLAG antibody and γ-tubulin as a loading control. B, strand-specific qRT-PCR analysis of total RNA collected from U2OS 2-6-3/YFP-MS2/rtTA, expressing control pLKO.1 and H3.3 shRNA constructs, 0 and 3 h after activation with doxycycline. C, qRT-PCR analysis of hH3F3A and hH3F3B mRNA levels in U2OS 2-6-3/YFP-MS2/rtTA cells after knockdown with gene-specific shRNAs. Shown is Western blot analysis of H3.3 levels in control and knockdown cells using an H3.3-specific antibody and γ-tubulin as a loading control.
FIGURE 9.
FIGURE 9.
Models of RNA-mediated H3.3 recruitment. A, model of Daxx- and ATRX-mediated transcriptional repression of the CMV promoter-regulated transcription site. When both Daxx and ATRX are present, H3.3 is incorporated into the nucleosomes at the array, and the transcriptional activator is unable to access its binding sites and recruit RNA polymerase II to the site. In the ATRX-null U2OS cell line, the activator is able to accumulate at the transcription site and induce transcription. Under these conditions, S and AS RNA accumulate at the activated site. Sequences in the N-terminal tail and αN helix mediate H3.3 recruitment to the activated transgene array. H3.3 colocalizes with RNA at the activated site but is not incorporated into the chromatin. B, RI H3.3 chromatin assembly can be divided into recruitment and chromatin assembly steps. In step 1, an epigenetic transcriptional regulatory event triggers H3.3 recruitment to its site of incorporation. N-terminal tail and αN helix sequences, which are 100% conserved between H3.1, H3.2, and H3.3, mediate recruitment, which means that all three variants can be recruited. In step 2, the H3.3-specific chaperones present at the incorporation site specifically utilize H3.3 for chromatin assembly.

Similar articles

Cited by

References

    1. Talbert P. B., Henikoff S. (2010) Histone variants. Ancient wrap artists of the epigenome. Nat. Rev. Mol. Cell Biol. 11, 264–275 - PubMed
    1. Santaguida S., Musacchio A. (2009) The life and miracles of kinetochores. EMBO J. 28, 2511–2531 - PMC - PubMed
    1. Waterborg J. H. (2012) Evolution of histone H3. Emergence of variants and conservation of post-translational modification sites. Biochem. Cell Biol. 90, 79–95 - PubMed
    1. Ahmad K., Henikoff S. (2002) The histone variant H3.3 marks active chromatin by replication-independent nucleosome assembly. Mol. Cell 9, 1191–1200 - PubMed
    1. Schwartz B. E., Ahmad K. (2005) Transcriptional activation triggers deposition and removal of the histone variant H3.3. Genes Dev. 19, 804–814 - PMC - PubMed

Publication types

LinkOut - more resources