. 2013 Aug;81(8):2733-42.
doi: 10.1128/IAI.01329-12. Epub 2013 May 20.

Fitness, stress resistance, and extraintestinal virulence in Escherichia coli

Affiliations

Fitness, stress resistance, and extraintestinal virulence in Escherichia coli

Alexandre Bleibtreu et al. Infect Immun. 2013 Aug.

Abstract

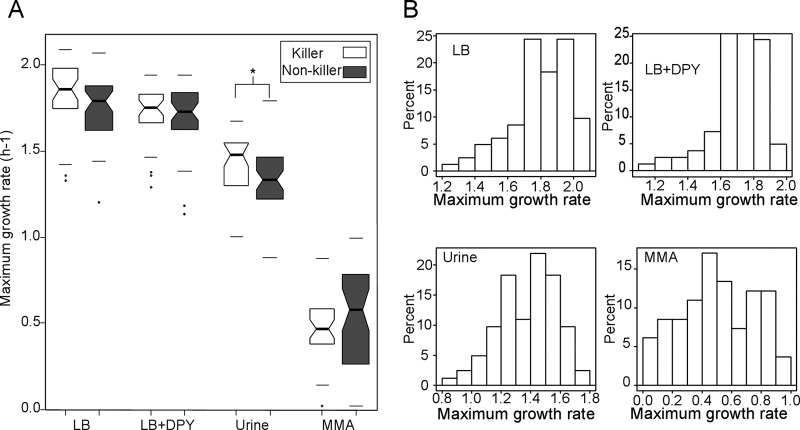
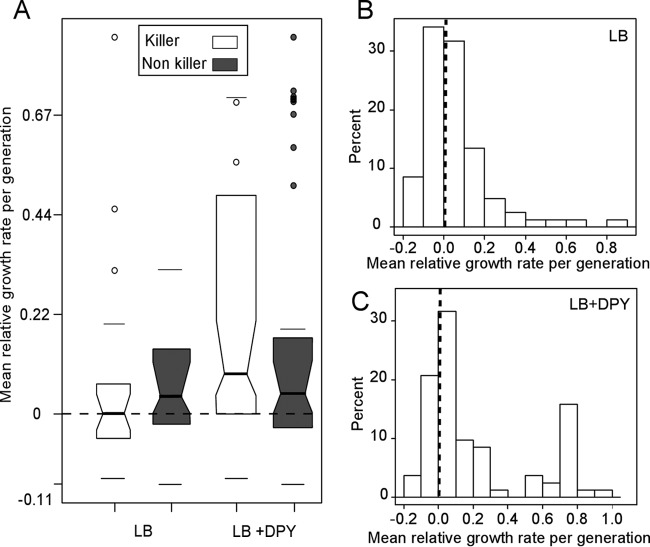
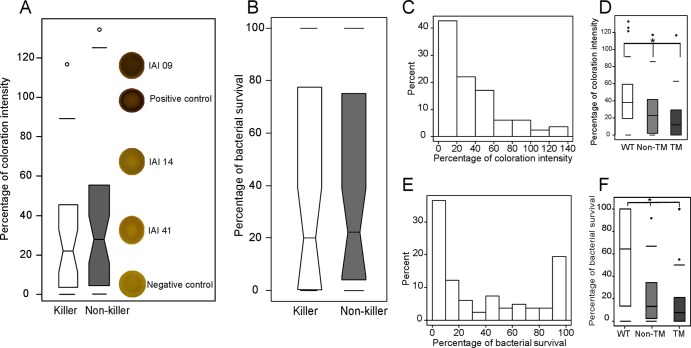
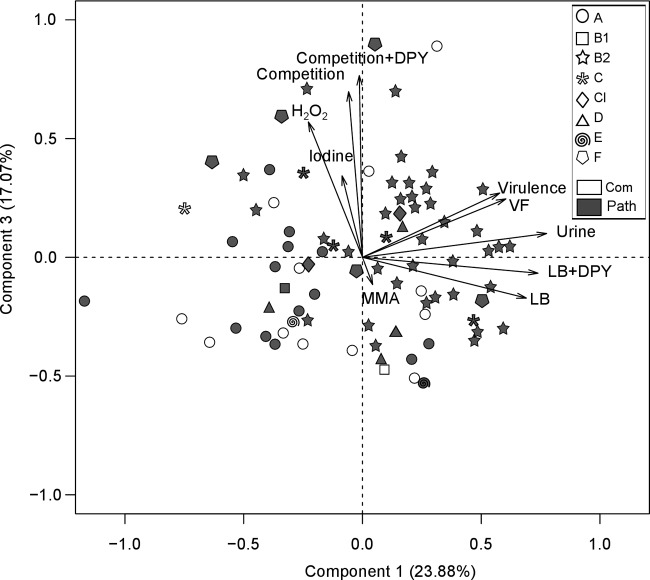
The extraintestinal virulence of Escherichia coli is dependent on numerous virulence genes. However, there is growing evidence for a role of the metabolic properties and stress responses of strains in pathogenesis. We assessed the respective roles of these factors in strain virulence by developing phenotypic assays for measuring in vitro individual and competitive fitness and the general stress response, which we applied to 82 commensal and extraintestinal pathogenic E. coli strains previously tested in a mouse model of sepsis. Individual fitness properties, in terms of maximum growth rates in various media (Luria-Bertani broth with and without iron chelator, minimal medium supplemented with gluconate, and human urine) and competitive fitness properties, estimated as the mean relative growth rate per generation in mixed cultures with a reference fluorescent E. coli strain, were highly diverse between strains. The activity of the main general stress response regulator, RpoS, as determined by iodine staining of the colonies, H2O2 resistance, and rpoS sequencing, was also highly variable. No correlation between strain fitness and stress resistance and virulence in the mouse model was found, except that the maximum growth rate in urine was higher for virulent strains. Multivariate analysis showed that the number of virulence factors was the only independent factor explaining the virulence in mice. At the species level, growth capacity and stress resistance are heterogeneous properties that do not contribute significantly to the intrinsic virulence of the strains.


Figures

Fig 1
Fig 1
MGR of 82 E. coli strains in four different media. MGR is expressed in h−1. The four media are LB broth, LB broth supplemented with 2-2′ dipyridyl (LB-DPY), urine, and minimal medium supplemented with gluconate (MMA). (A) Results are presented as box plots representing the distributions of MGRs calculated from three independent culture assays. The black bars within each box plot represent the median values. The upper and lower limits of the box correspond to the upper and lower quartiles, respectively. Bars above and below the box correspond to 1.5 times the interquartile range. Dots located at some distance outside the box correspond to outliers lying more than 1.5 times beyond the interquartile range. Strains were grouped into two categories (killer strains and nonkiller strains), on the basis of the number of mice killed (see Materials and Methods). *, significant difference between the two groups of strains (Wilcoxon test, P < 0.05). (B) Results are presented as histograms representing the distributions of MGRs calculated from three independent culture assays in the four media tested.
Fig 2
Fig 2
Relative growth rate of 82 E. coli strains in competition with the E. coli Venus strain. (A) The mean relative growth rate per generation of each strain of the IAI collection in competition with the fluorescent Venus strain is shown on the y axis. A 0 indicates the absence of a change in the proportion of the two competing strains after 48 h (black dotted line), with the winner and loser strains having positive and negative values, respectively. Box plots show the distribution of the median values obtained following the application of a linear model to the results of three independent competition assays. On the x axis, strains are classified as a function of the competition medium (LB medium and LB-DPY). The black bars within each box plot indicate the median values. The upper and lower limits of the box correspond to the upper and lower quartiles, respectively. Bars above and below the box indicate 1.5 times the interquartile range. Dots located at some distance outside the box correspond to outliers lying more than 1.5 times outside the interquartile range. Strains were grouped into two categories (killer strains and nonkiller strains), on the basis of the number of mice killed (see the Materials and Methods). The results are also presented as histograms representing the distributions of the mean relative growth rate per generation of the strains of the IAI collection in LB medium (B) and LB-DPY (C). Black dotted lines, absence of a change in the proportions of the two competing strains after 48 h.
Fig 3
Fig 3
RpoS activity phenotypes (iodine staining and H2O2 resistance) of the 82 strains of E. coli. (A and C) Iodine staining of patches of bacteria from the IAI collection. (A) The y axis represents the percent staining of each bacterial patch with iodine with respect to the positive (100%; strain with high levels of RpoS activity [27]) and negative (0%; E. coli K-12 MG1655 ΔrpoS) controls. Box plots show the distribution of median values obtained in two independent experiments. The black bars within each box plot correspond to the median values. The upper and lower limits of the box correspond to the upper and lower quartiles, respectively. Bars above and below the box correspond to 1.5 times the interquartile range. Dots located at some distance from the box correspond to outliers lying beyond 1.5 times the interquartile range. Strains were grouped into two categories (killer strains in white and nonkiller strains in gray), on the basis of the number of mice killed (see the Materials and Methods). Patches for the various strains tested and for the two control strains stained with iodine are shown on the right of panel A. (C) The distribution of percent staining intensity is presented as a histogram. (B and E) Bacterial survival after incubation for 60 min with 5 mM H2O2. The results are presented in box plots (B), as described for panel A, whereas the distribution is given as a histogram (E). (D and F) Percent staining intensity (D) and bacterial survival after H2O2 challenge (F) presented as box plots according to the rpoS sequence. WT, Non-TM, and TM, wild-type rpoS, nontruncating mutations of rpoS, and truncating mutations of rpoS, respectively. *, significant differences between groups of strains (Wilcoxon test, P < 0.05).
Fig 4
Fig 4
PCA for 82 E. coli strains, based on all the data. The first and third principal component scores of each variable are plotted against each other on the plane. Each arrow represents the projection of a variable subjected to PCA: VF, number of virulence genes detected in the strain; Virulence, number of mice killed per strain in the mouse model of septicemia; LB, LB-DPY, urine, and MMA, MGRs obtained for LB broth, LB broth supplemented with 2-2′-dipyridyl medium, urine, and minimal medium supplemented with gluconate, respectively; Competition and Competition-DPY, fitness in competition with the Venus strain in LB medium and LB-DPY, respectively; Iodine, percent staining intensity with iodine; H2O2, percent bacterial survival after 60 min of incubation with 5 mM H2O2. Only variables far from the center can be analyzed. If the variables are close to each other, they are significantly positively correlated; if they are orthogonal, they are not correlated; if they are on opposite sides of the center, they are significantly negatively correlated. The projections of the strains on the plane are represented with symbols (phylogenetic groups) and colors (commensal/pathogenic [Com/Path] isolation conditions).

References

    1. Karch H, Denamur E, Dobrindt U, Finlay BB, Hengge R, Johannes L, Ron EZ, Tonjum T, Sansonetti PJ, Vicente M. 2012. The enemy within us: lessons from the 2011 European Escherichia coli O104:H4 outbreak. EMBO Mol. Med. 4:841–848 - PMC - PubMed
    1. Russo TA, Johnson JR. 2003. Medical and economic impact of extraintestinal infections due to Escherichia coli: focus on an increasingly important endemic problem. Microbes Infect. 5:449–456 - PubMed
    1. Lefort A, Panhard X, Clermont O, Woerther PL, Branger C, Mentre F, Fantin B, Wolff M, Denamur E. 2011. Host factors and portal of entry outweigh bacterial determinants to predict the severity of Escherichia coli bacteremia. J. Clin. Microbiol. 49:777–783 - PMC - PubMed
    1. Tenaillon O, Skurnik D, Picard B, Denamur E. 2010. The population genetics of commensal Escherichia coli. Nat. Rev. Microbiol. 8:207–217 - PubMed
    1. Desjardins P, Picard B, Kaltenbock B, Elion J, Denamur E. 1995. Sex in Escherichia coli does not disrupt the clonal structure of the population: evidence from random amplified polymorphic DNA and restriction-fragment-length polymorphism. J. Mol. Evol. 41:440–448 - PubMed

Publication types

Substances

LinkOut - more resources