

Experimentally calibrated population of models predicts and explains intersubject variability in cardiac cellular electrophysiology
- PMID: 23690584
- PMCID: PMC3677477
- DOI: 10.1073/pnas.1304382110
Experimentally calibrated population of models predicts and explains intersubject variability in cardiac cellular electrophysiology
Abstract
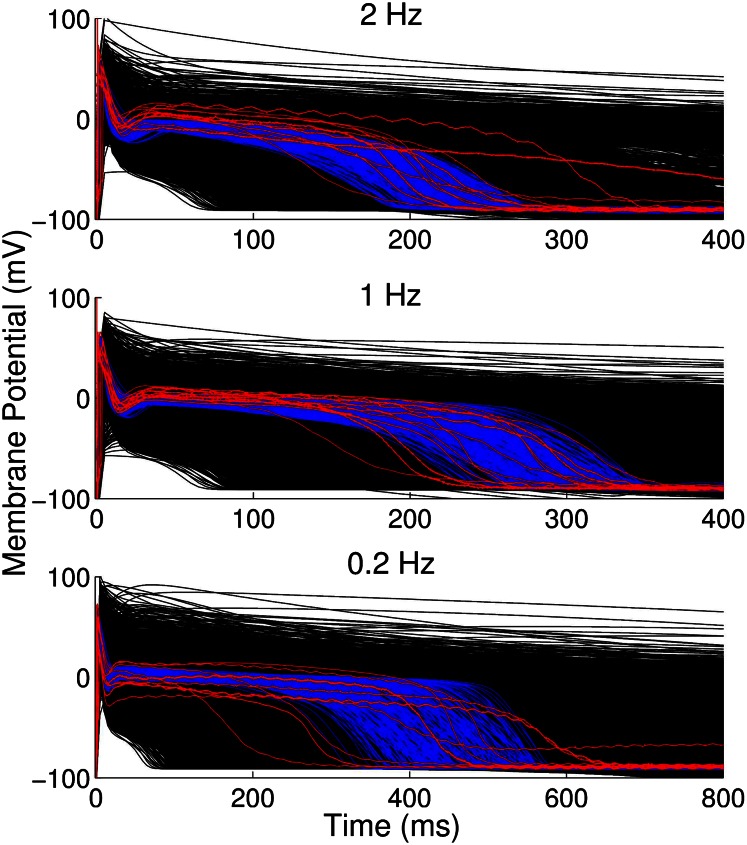
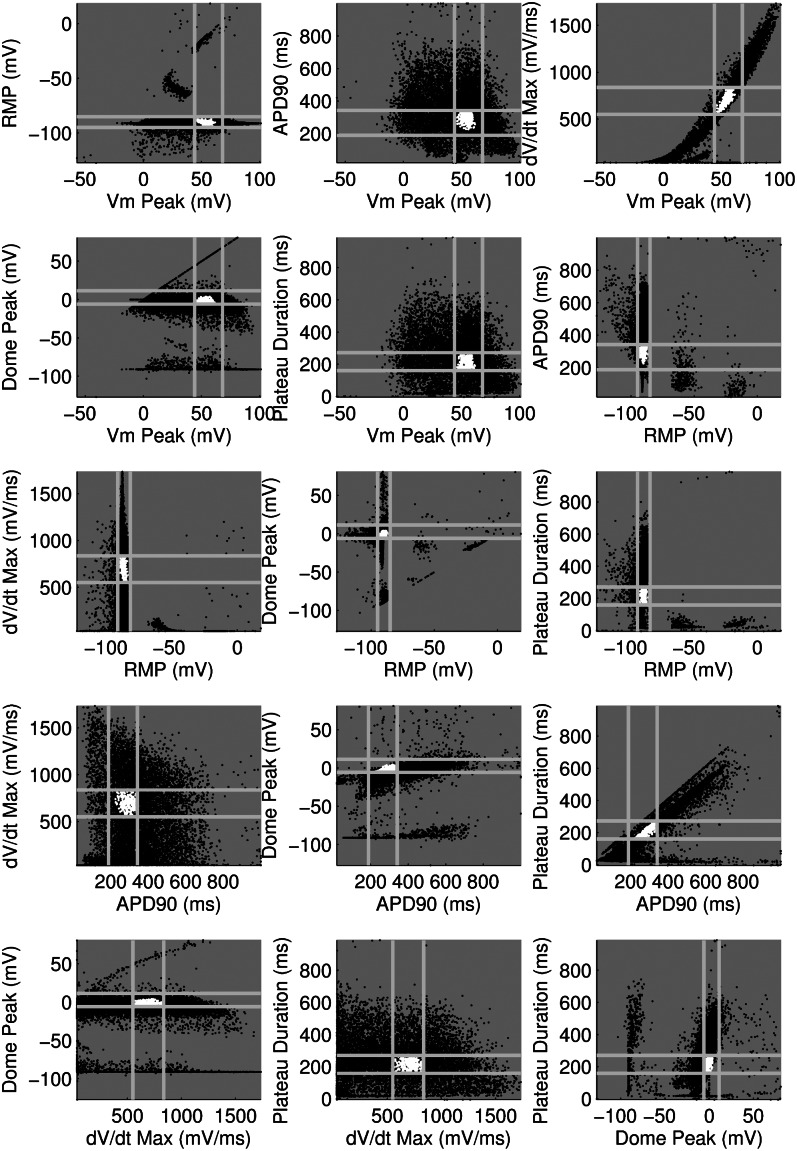
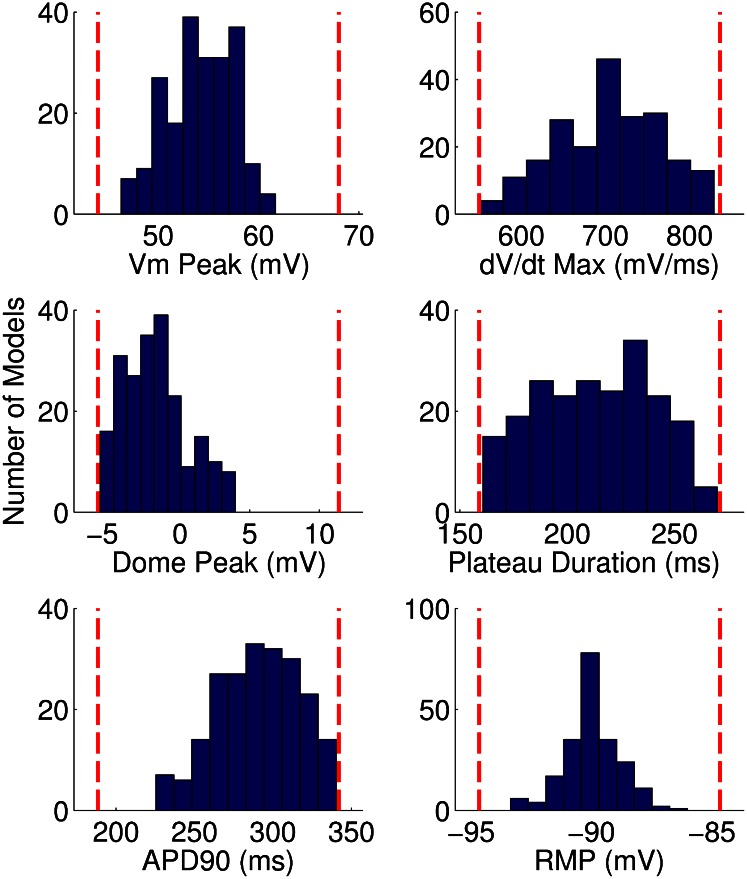
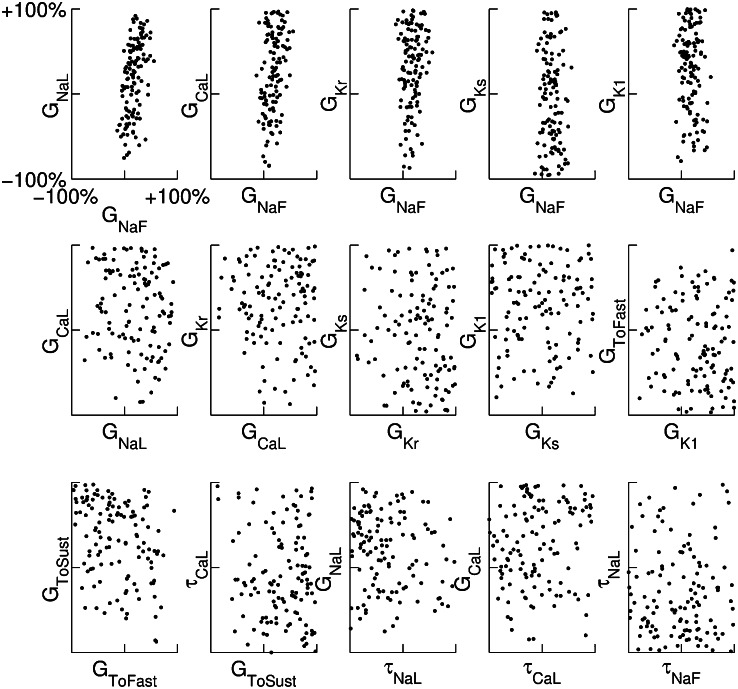
Cellular and ionic causes of variability in the electrophysiological activity of hearts from individuals of the same species are unknown. However, improved understanding of this variability is key to enable prediction of the response of specific hearts to disease and therapies. Limitations of current mathematical modeling and experimental techniques hamper our ability to provide insight into variability. Here, we describe a methodology to unravel the ionic determinants of intersubject variability exhibited in experimental recordings, based on the construction and calibration of populations of models. We illustrate the methodology through its application to rabbit Purkinje preparations, because of their importance in arrhythmias and safety pharmacology assessment. We consider a set of equations describing the biophysical processes underlying rabbit Purkinje electrophysiology, and we construct a population of over 10,000 models by randomly assigning specific parameter values corresponding to ionic current conductances and kinetics. We calibrate the model population by closely comparing simulation output and experimental recordings at three pacing frequencies. We show that 213 of the 10,000 candidate models are fully consistent with the experimental dataset. Ionic properties in the 213 models cover a wide range of values, including differences up to ±100% in several conductances. Partial correlation analysis shows that particular combinations of ionic properties determine the precise shape, amplitude, and rate dependence of specific action potentials. Finally, we demonstrate that the population of models calibrated using data obtained under physiological conditions quantitatively predicts the action potential duration prolongation caused by exposure to four concentrations of the potassium channel blocker dofetilide.
Keywords: cardiac electrophysiology; computational biology; drug; mathematical modeling; systems biology.
Conflict of interest statement
The authors declare no conflict of interest.
Figures
 ,
,  ,
,  ,
,  ,
,  ,
,  ,
,  ,
,  ,
,  ,
,  , and
, and ). The scale in all graphs includes ±100% variation with respect to the original value. A representative sample of possible pairings is shown.
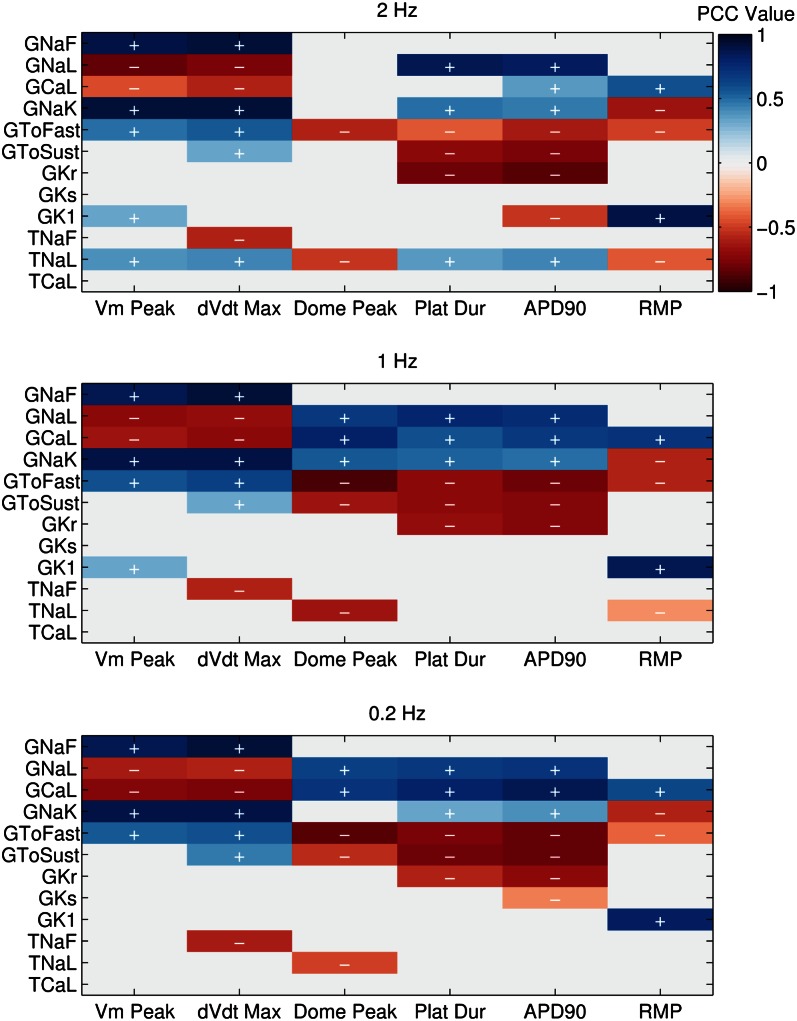
 and
and  , positive and negative correlation, respectively.
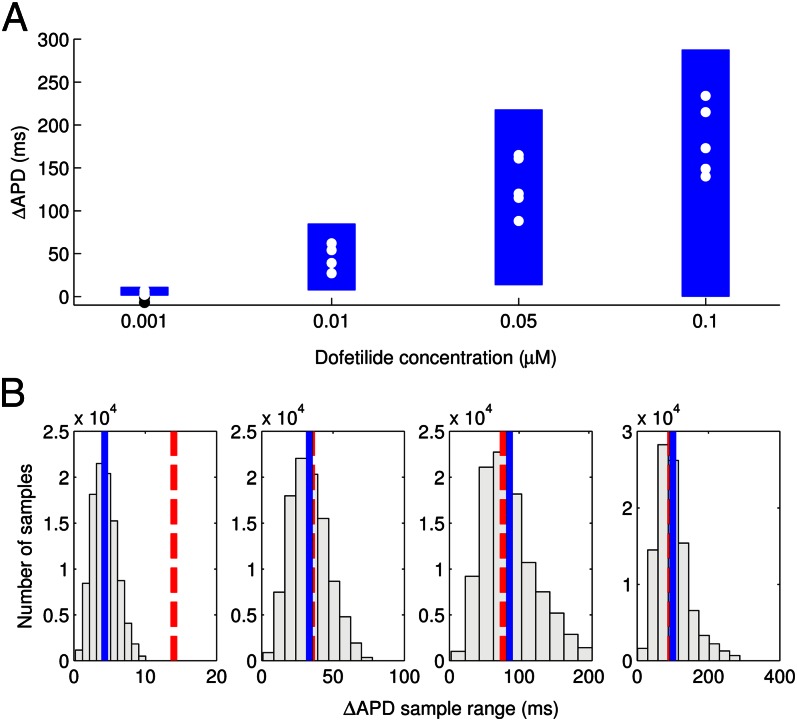
 prolongation (ΔAPD) caused by four concentrations of dofetilide using the models in the calibrated population. Dots indicate values of ΔAPD independently obtained in five experiments using rabbit Purkinje fiber preparations. (B) Histograms of dofetilide-induced ΔAPD range across sets of 5 models randomly sampled from the calibrated population. A total of 100,000 different sets of five models were used. The range of ΔAPD was calculated as maximum value of ΔAPD − minimum value of ΔAPD, for each set of five models. For each dofetilide concentration, the mean value of the ΔAPD range across the 100,000 samples of five models is shown by a solid blue line, and the ΔAPD range from our experimental data is shown by the dashed red line.
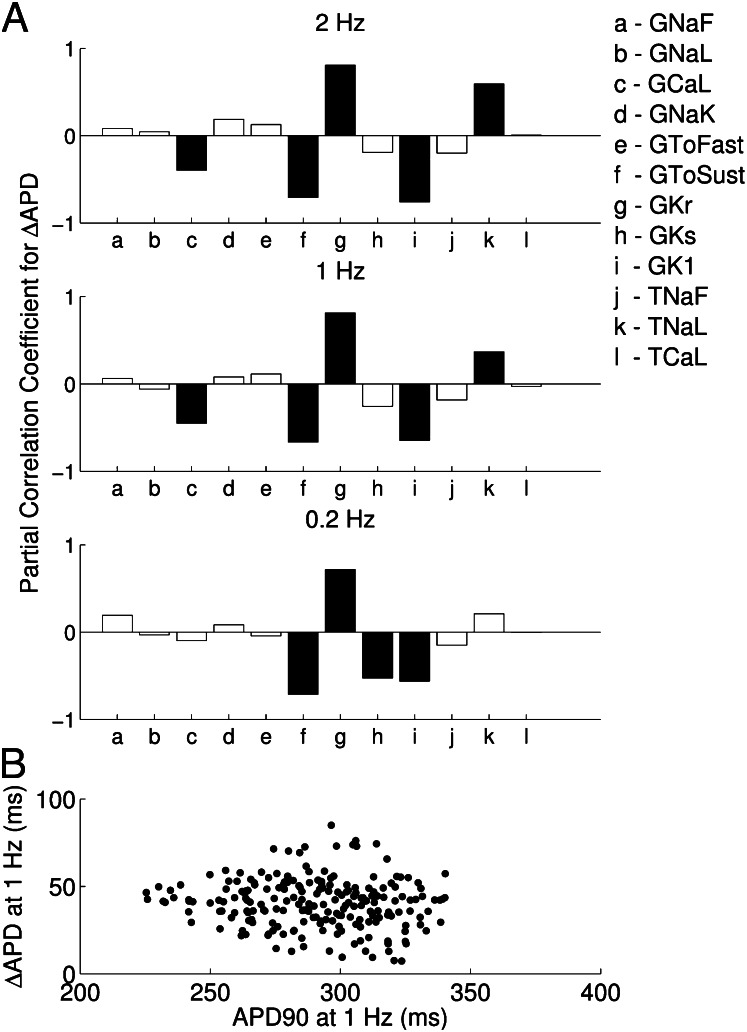
 block from a 0.01 μM dofetilide concentration, at each of the three pacing frequencies. ΔAPD was correlated against each of the 12 parameters that were varied to create the population of models, each time controlling for the other 11 parameters as part of the partial correlation process. Three models with outlying values of ΔAPD at 0.2 Hz (ΔAPD = 318, 364, and 395 ms, compared with the rest of the model population’s sample mean of 69 ms ± 26 ms) were excluded from the analysis as they dominate the other models when calculating the PCCs at that frequency. Solid bars denote significant correlations with P < 10−5, and empty bars indicate correlations with P > 10−5. (B) Scatter plot of control
  values of each accepted model at 1 Hz against ΔAPD attributable to
  block from 0.01 μM concentration of dofetilide.
References
-
- Carusi A, Burrage K, Rodríguez B. Bridging experiments, models and simulations: An integrative approach to validation in computational cardiac electrophysiology. Am J Physiol Heart Circ Physiol. 2012;303(2):H144–H155. - PubMed
-
- Romero L, Pueyo E, Fink M, Rodríguez B. Impact of ionic current variability on human ventricular cellular electrophysiology. Am J Physiol Heart Circ Physiol. 2009;297(4):H1436–H1445. - PubMed
-
- Davies MR, et al. An in silico canine cardiac midmyocardial action potential duration model as a tool for early drug safety assessment. Am J Physiol Heart Circ Physiol. 2012;302(7):H1466–H1480. - PubMed
Publication types
MeSH terms
Substances
Grants and funding
LinkOut - more resources
Full Text Sources
Other Literature Sources
