

Deciphering the impacts of vaccination and immunity on pertussis epidemiology in Thailand
- PMID: 23690587
- PMCID: PMC3677483
- DOI: 10.1073/pnas.1220908110
Deciphering the impacts of vaccination and immunity on pertussis epidemiology in Thailand
Abstract
Pertussis is a highly infectious respiratory disease that is currently responsible for nearly 300,000 annual deaths worldwide, primarily in infants in developing countries. Despite sustained high vaccine uptake, a resurgence in pertussis incidence has been reported in a number of countries. This resurgence has led to critical questions regarding the transmission impacts of vaccination and pertussis immunology. We analyzed pertussis incidence in Thailand--both age-stratified and longitudinal aggregate reports--over the past 30 y. To dissect the contributions of waning pertussis immunity and repeat infections to pertussis epidemiology in Thailand following a pronounced increase in vaccine uptake, we used likelihood-based statistical inference methods to evaluate the support for multiple competing transmission models. We found that, in contrast to other settings, there is no evidence for pertussis resurgence in Thailand, with each model examined pointing to a substantial rise in herd immunity over the past 30 y. Using a variety of empirical metrics, we verified our findings by documenting signatures of changing herd immunity over the study period. Importantly, this work leads to the conclusion that repeat infections have played little role in shaping pertussis epidemiology in Thailand. Our results are surprisingly emphatic in support of measurable impact of herd immunity given the uncertainty associated with pertussis epidemiology.
Conflict of interest statement
The authors declare no conflict of interest.
Figures

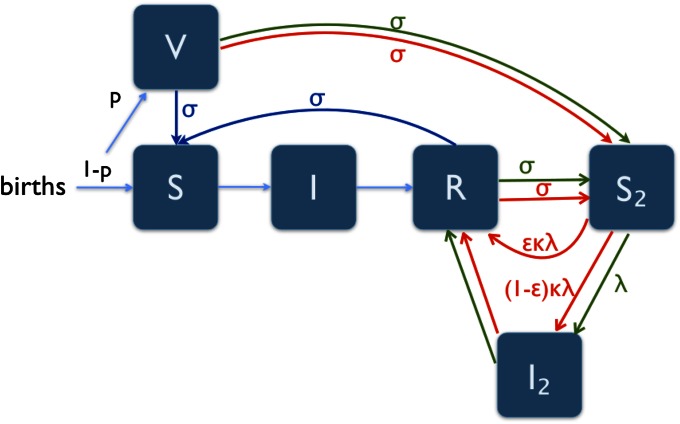
 model includes green; and the
  model includes red lines and text. Here, λ is the force of infection, p is the fraction of infants vaccinated, σ is the rate of immunity loss, ε is the probability that a susceptible individual who was previously vaccinated or infected has their immunity boosted upon exposure, and κ is the boosting coefficient.
 (green, model III), and
  (red, model IV) models. Likelihood values are rescaled so that zero corresponds to the best likelihood for each model, and the vertical dashed line indicates the upper bound for the 95% confidence interval (
 years is the lower bound of the confidence interval for models II and III). The duration of immunity is not identifiable for model IV. (B) Simulations of the reported cases for each model using the associated MLE parameters. In each, the dark line is the average over 1,000 realizations of the model, and light shading represents the upper and lower quartiles. (Upper) Simulations of models II–IV. (Lower) Black line is the data, and the light blue represents simulations from the best-fitting model (model I, SIR). The corresponding
  values (computed as 1 − SSE/SST where SSE is the error sum of squares and SST is the total sum of squares) are 0.93, −1.0, 0.22, and 0.92 for models I–IV, respectively. (Inset) Cumulative conditional log-likelihood values for each model. All models perform well during the first vaccine era, but the performance of models II and III significantly declines during the final vaccine era because these models are unable to capture the transition to very low incidence, even with long durations of immunity.
 where N is the population size and A and b are the estimated parameters] are fit to each vaccine era using standard regression techniques to determine an estimate of the CCS; similar protocols have been used elsewhere (23). Bangkok is excluded from the fit as it is an outlier due to its high population size relative to other provinces (∼5 × 10⁶). The horizontal dashed gray line represents a mean of one fadeout per year, and the intersection of the vertical dashed red and black lines with the gray line represents the estimated CCS in the first and second vaccine eras, respectively. Below the CCS, frequent disease extinctions are expected to occur. Though some of the shift may be attributed to an increase in the age of infection, leading to more asymptomatic cases, the magnitude of the shifts strongly points to reduced transmission following vaccination (

References
-
- Creighton C. A History of Epidemics in Britain. London: Frank Cass; 1894.
-
- Bass JW, Stephenson SR. The return of pertussis. Pediatr Infect Dis J. 1987;6(2):141–144. - PubMed
-
- Rohani P, Earn DJ, Grenfell BT. Opposite patterns of synchrony in sympatric disease metapopulations. Science. 1999;286(5441):968–971. - PubMed
-
- Güriş D, et al. Changing epidemiology of pertussis in the United States: Increasing reported incidence among adolescents and adults, 1990–1996. Clin Infect Dis. 1999;28(6):1230–1237. - PubMed
-
- Wood N, McIntyre P. Pertussis: Review of epidemiology, diagnosis, management and prevention. Paediatr Respir Rev. 2008;9(3):201–212. - PubMed
Publication types
MeSH terms
Substances
Grants and funding
LinkOut - more resources
Full Text Sources
Other Literature Sources
Medical
Miscellaneous
