. 2013:7:843-58.
doi: 10.2147/OPTH.S44009. Epub 2013 May 8.

The role of hemifield sector analysis in multifocal visual evoked potential objective perimetry in the early detection of glaucomatous visual field defects

Affiliations

The role of hemifield sector analysis in multifocal visual evoked potential objective perimetry in the early detection of glaucomatous visual field defects

Mohammad F Mousa et al. Clin Ophthalmol. 2013.

Abstract

Objective: The purpose of this study was to examine the effectiveness of a new analysis method of mfVEP objective perimetry in the early detection of glaucomatous visual field defects compared to the gold standard technique.

Methods and patients: Three groups were tested in this study; normal controls (38 eyes), glaucoma patients (36 eyes), and glaucoma suspect patients (38 eyes). All subjects underwent two standard 24-2 visual field tests: one with the Humphrey Field Analyzer and a single mfVEP test in one session. Analysis of the mfVEP results was carried out using the new analysis protocol: the hemifield sector analysis protocol.

Results: Analysis of the mfVEP showed that the signal to noise ratio (SNR) difference between superior and inferior hemifields was statistically significant between the three groups (analysis of variance, P < 0.001 with a 95% confidence interval, 2.82, 2.89 for normal group; 2.25, 2.29 for glaucoma suspect group; 1.67, 1.73 for glaucoma group). The difference between superior and inferior hemifield sectors and hemi-rings was statistically significant in 11/11 pair of sectors and hemi-rings in the glaucoma patients group (t-test P < 0.001), statistically significant in 5/11 pairs of sectors and hemi-rings in the glaucoma suspect group (t-test P < 0.01), and only 1/11 pair was statistically significant (t-test P < 0.9). The sensitivity and specificity of the hemifield sector analysis protocol in detecting glaucoma was 97% and 86% respectively and 89% and 79% in glaucoma suspects. These results showed that the new analysis protocol was able to confirm existing visual field defects detected by standard perimetry, was able to differentiate between the three study groups with a clear distinction between normal patients and those with suspected glaucoma, and was able to detect early visual field changes not detected by standard perimetry. In addition, the distinction between normal and glaucoma patients was especially clear and significant using this analysis.

Conclusion: The new hemifield sector analysis protocol used in mfVEP testing can be used to detect glaucomatous visual field defects in both glaucoma and glaucoma suspect patients. Using this protocol, it can provide information about focal visual field differences across the horizontal midline, which can be utilized to differentiate between glaucoma and normal subjects. The sensitivity and specificity of the mfVEP test showed very promising results and correlated with other anatomical changes in glaucomatous visual field loss. The intersector analysis protocol can detect early field changes not detected by the standard Humphrey Field Analyzer test.

Keywords: HFA; SAP; glaucoma suspect; glaucomatous field loss; multifocal VEP; objective perimetry; visual field testing.


Figures

Figure 1
Figure 1
The 58 segments of the right visual field. The field is divided into two identical hemifields across the horizontal meridian; each segment has a similar correspondent in the opposite hemifield (A) the SNR value is calculated in each segment. The average SNR of the wedge sectors (B) and semi-circular sector; peripheral and central (C and D) are calculated to compare to the fellow corresponding sector on the opposite hemifield. Abbreviation: SNR, signal to noise ratio.
Figure 2
Figure 2
The five allocated hemi-rings and their corresponding fellows in both hemispheres (A). The allocated six sectors and their corresponding fellows in both hemispheres (B). Abbreviations: IR, inferior hemi-ring; IS, inferior sector; SR, superior hemi-ring; SS, superior sector.
Figure 3
Figure 3
Receiver operating characteristic analysis for the glaucoma suspect group by multifocal VEP test in glaucoma suspect group. Notes: Area under curve = 0.892 and sensitivity was 89%. The 79% at 2.38 SNR value was taken as the cutoff for a glaucoma suspect. The green line represents uniformed random values, the blue line is true data distribution. Abbreviations: SNR, signal to noise ratio; VEP, visual evoked potential.
Figure 4
Figure 4
Receiver operating characteristic analysis for the glaucoma group by multifocal VEP test in glaucoma suspect group. Notes: Area under curve = 0.989. Sensitivity was 97% and specificity was 86% for the detection of glaucoma. We calculated the 97% at the 1.99 SNR value as the cut-off for glaucoma. The green line represents uniformed random values, the blue line is true data distribution. Abbreviations: SNR, signal to noise ratio; VEP, visual evoked potential.
Figure 5
Figure 5
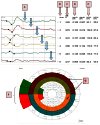
Components of the hemifield sector/hemi-ring analysis printout. Analysis components; color-coded averaged waveforms from the sector or hemi-ring (A), sector/hemi-ring waveform numbers (B), average SNR value for each sector/hemi-ring (C), positive peak amplitude (D), positive peak latency (E), color-coded sectors for comparison (F), color-coded hemi-rings for comparison (G). Abbreviations: AMP, amplitude; N1, negative peak 1; P1, positive peak 1; PeT, peak time; SNR, signal to noise ratio.
Figure 6
Figure 6
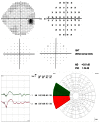
Role of the HSA protocol in identifying early field changes. Notes: SITA standard 24-2 test and the mfVEP intersector HSA comparison in a glaucoma suspect patient. No significant visual field defects were recorded in the SITA test; neither in the total deviation or the pattern deviation plots. The GHT outcome was “within normal limits”. The intersector analysis showed a significant difference between the nasal sectors (SS1 = 2.49 and IS1 = 1.96) pointing to an early inferior reduced response. This difference could reflect an early functional change in the visual field that could not be detected by the SITA standard test. Abbreviations: AMP, amplitude; GHT, glaucoma hemifield test; HSA, hemifield sector analysis; IS1, inferior sector number 1; SS1, superior sector number 1; MD, mean deviation; mfVEP, multifocal visual evoked potential; N1, negative peak 1; P1, positive peak 1; PeT, peak time; PSD, pattern standard deviation; SITA, swedish interactive threshold algorithm.
Figure 7
Figure 7
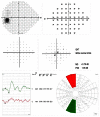
Another example of a possible early detection of a visual field defect using the SITA standard 24-2 test and mfVEP intersector HSA comparison in a glaucoma suspect patient. Notes: No significant visual field defects were recorded in the SITA test; neither in the total deviation or pattern deviation plots. The GHT was “within normal limits”. The intersector analysis showed a significant difference between the nasal sectors (SS1 = 2.06 and IS1 = 4.61) pointing to an early superior reduced response. This difference could reflect an early functional change in the visual field which could not be detected by the SITA standard test. Abbreviations: AMP, amplitude; GHT, glaucoma hemifield test; HSA, hemifield sector analysis; IS1, inferior sector number 1; SS1, superior sector number 1; MD, mean deviation; mfVEP, multifocal visual evoked potential; N1, negative peak 1; P1, positive peak 1; PeT, peak time; PSD, pattern standard deviation; SITA, swedish interactive threshold algorithm.
Figure 8
Figure 8
An additional example of a possible early detection of a visual field defect using the SITA standard 24-2 test and mfVEP intersector HSA comparison in a glaucoma suspect patient. Notes: No significant visual field defects recorded in the SITA test. Some focal depression in the pattern deviation plot was present without any change in the total deviation plot. The GHT outcome was “within normal limits”. The intersector analysis showed a significant difference between the nasal sectors (SS1 = 1.43 and IS1 = 2.28) pointing to a significant superior reduced response compared to the inferior sector. This difference could reflect an early functional change in the visual field that could not be detected by the SITA standard test. Abbreviations: AMP, amplitude; GHT, glaucoma hemifield test; HSA, hemifield sector analysis; IS1, inferior sector number 1; SS1, superior sector number 1; MD, mean deviation; mfVEP, multifocal visual evoked potential; N1, negative peak 1; P1, positive peak 1; PeT, peak time; PSD, pattern standard deviation; SITA, swedish interactive threshold algorithm.
Figure 9
Figure 9
An example of possible early detection of a visual field defect using the SITA standard 24-2 test and the mfVEP hemi-ring comparison analysis in a glaucoma suspect. Notes: No significant visual field defects were recorded in the SITA test. Some focal depression was present in the pattern deviation plot with a single location in the total deviation plot. The GHT was “within normal limits”. The inner hemi-ring (SR4-IR4) analysis showed a significant difference between the superior and inferior hemi-rings (SR4 = 2.07 and IR4 = 2.77) pointing to significant superior reduced response. This difference may reflect an early functional change in the visual field that could not be detected by the SITA standard test. Abbreviations: AMP, amplitude; GHT, glaucoma hemifield test; HSA, hemifield sector analysis; IR4, inferior ring number 4; SR4, superior ring number 4; MD, mean deviation; mfVEP, multifocal visual evoked potential; N1, negative peak 1; P1, positive peak 1; PeT, peak time; PSD, pattern standard deviation; SITA, swedish interactive threshold algorithm.
Figure 10
Figure 10
A SITA standard 24-2 test and mfVEP test with HSA printout for a glaucoma patient with a moderate glaucomatous visual field defect. Notes: The SITA test identified a diffuse cluster of significant defects shown in both the total and pattern deviation plots, confirmed by the GHT. The intersector hemifield analysis confirmed the defect, where it shows the superior four sectors (numbered 1–4) with lower SNR values compared to their inferior corresponding ones (numbered 5–8). This agreement is confirmatory of the role of mfVEP intersector analysis in the detection of visual field defects. Abbreviations: AMP, amplitude; GHT, glaucoma hemifield test; HSA, hemifield sector analysis; MD, mean deviation; mfVEP, multifocal visual evoked potential; N1, negative peak 1; P1, positive peak 1; PeT, peak time; PSD, pattern standard deviation; SITA, swedish interactive threshold algorithm; SNR, signal to noise ratio.
Figure 11
Figure 11
A SITA standard 24-2 test and mfVEP test with HSA printout for a glaucoma suspect patient without any significant field defects. Notes: The GHT was “within normal limits”. The mfVEP intersector hemifield analysis showed a significant superior nasal reduction in the SNR value compared to its corresponding fellow sector in the inferior hemifield. SS1 shows a SNR value 1.99 (G4) and the IS1 SNR value is 5.18 (G1), indicating a superior nasal visual field defect. A repeated and reproducible mfVEP defect evidenced by the intersector analysis gave an indication that this defect was true and was detected at an earlier stage before SAP. Abbreviations: AMP, amplitude; G1, grade 1; GHT, glaucoma hemifield test; HSA, hemifield sector analysis; IS1, inferior sector number 1; SS1, superior sector number 1; MD, mean deviation; mfVEP, multifocal visual evoked potential; N1, negative peak 1; P1, positive peak 1; PeT, peak time; PSD, pattern standard deviation; SITA, swedish interactive threshold algorithm.

Similar articles

Cited by

References

    1. Kerrigan-Baumrind LA, Quigley HA, Pearse ME, Kerrigan DF, Mitchell RS. Number of ganglion cells in glaucoma eyes compared with threshold visual field tests in the same persons. Invest Ophthalmol Vis Sci. 2000;41(3):741–748. - PubMed
    1. Quigley HA, Dunkelberger GR, Green WR. Retinal ganglion cell atrophy correlated with automated perimetry in human eyes with glaucoma. Am J Ophthalmol. 1989;107(5):453–464. - PubMed
    1. McKendrick AM, Turpin A. Combining perimetric suprathreshold and threshold procedures to reduce measurement variability in areas of visual field loss. Optom Vis Sci. 2005;82(1):43–51. - PubMed
    1. Graham SL, Klistorner AI, Grigg JR, Billson FA. Objective perimetry in glaucoma: recent advances with multifocal stimuli. Surv Ophthalmol. 1999;43(Suppl 1):S199–S209. - PubMed
    1. Graham SL, Klistorner AI, Goldberg I. Clinical application of objective perimetry using multifocal visual evoked potentials in glaucoma practice. Arch Ophthalmol. 2005;123(6):729–739. - PubMed

LinkOut - more resources