

Application of 31P MR spectroscopy to the brain tumors
- PMID: 23690717
- PMCID: PMC3655304
- DOI: 10.3348/kjr.2013.14.3.477
Application of 31P MR spectroscopy to the brain tumors
Abstract
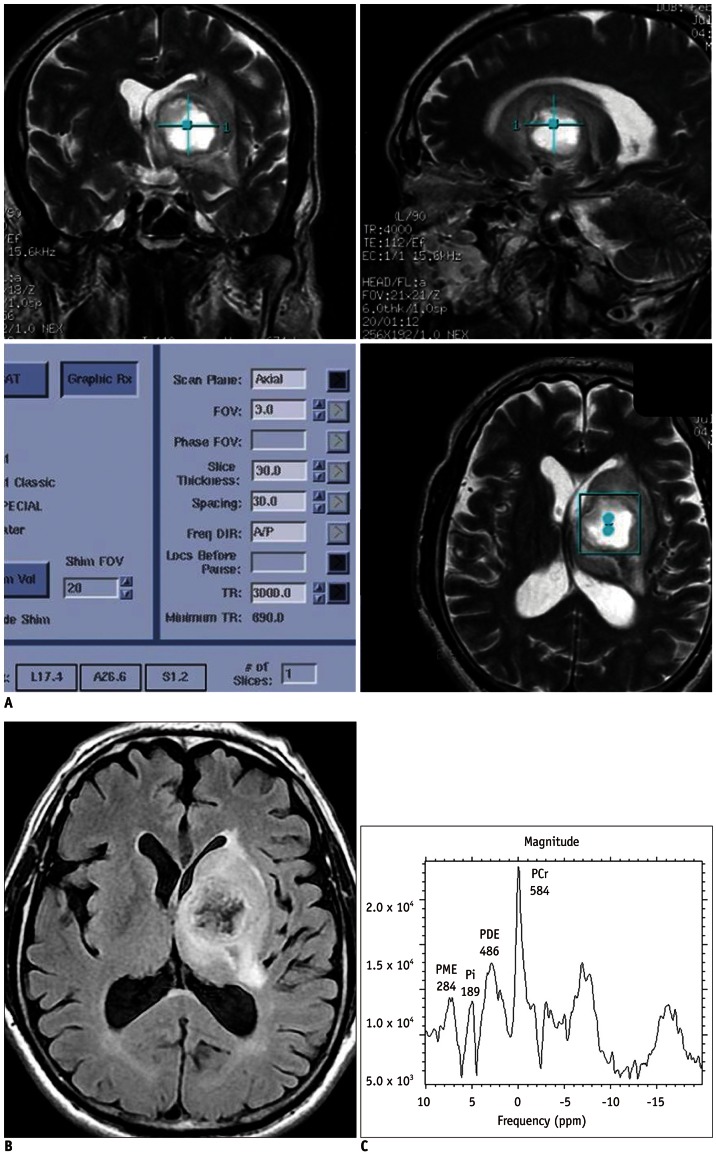
Objective: To evaluate the clinical feasibility and obtain useful parameters of (31)P magnetic resonance spectroscopy (MRS) study for making the differential diagnosis of brain tumors.
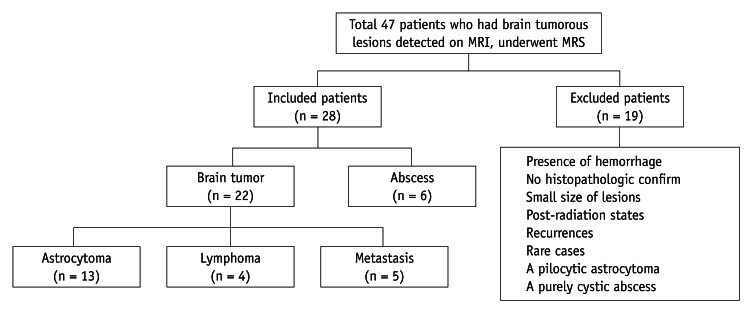
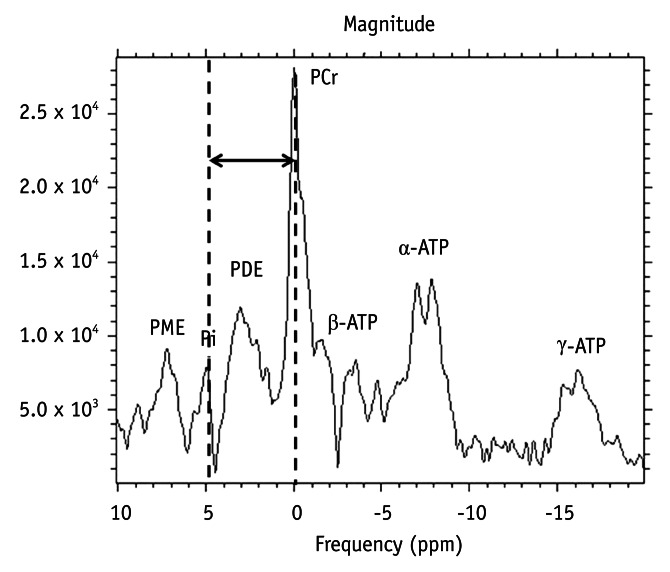
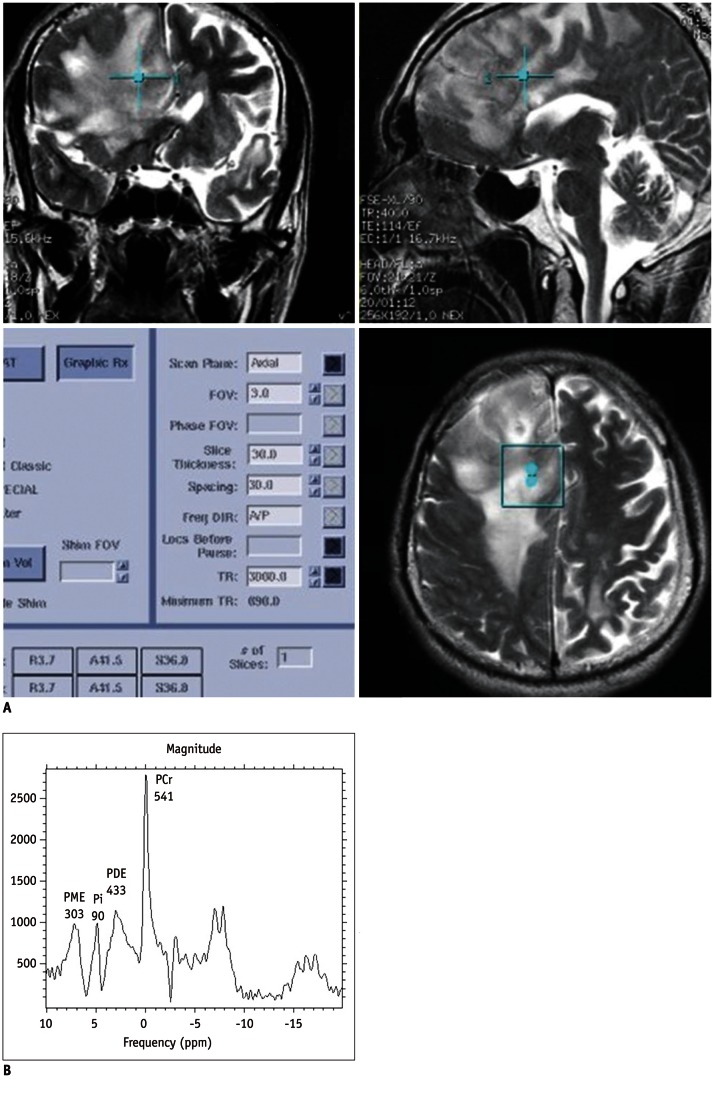
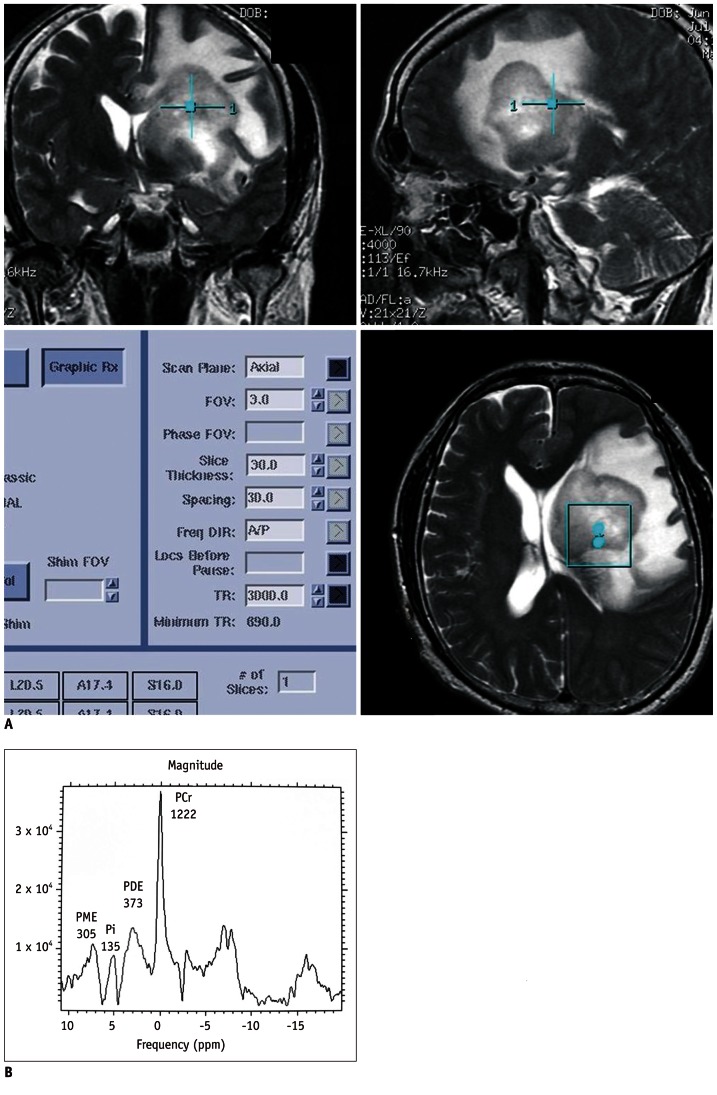
Materials and methods: Twenty-eight patients with brain tumorous lesions (22 cases of brain tumor and 6 cases of abscess) and 11 normal volunteers were included. The patients were classified into the astrocytoma group, lymphoma group, metastasis group and the abscess group. We obtained the intracellular pH and the metabolite ratios of phosphomonoesters/phosophodiesters (PME/PDE), PME/inorganic phosphate (Pi), PDE/Pi, PME/adenosine triphosphate (ATP), PDE/ATP, PME/phosphocreatine (PCr), PDE/PCr, PCr/ATP, PCr/Pi, and ATP/Pi, and evaluated the statistical significances.
Results: The brain tumors had a tendency of alkalization (pH = 7.28 ± 0.27, p = 0.090), especially the pH of the lymphoma was significantly increased (pH = 7.45 ± 0.32, p = 0.013). The brain tumor group showed increased PME/PDE ratio compared with that in the normal control group (p = 0.012). The ratios of PME/PDE, PDE/Pi, PME/PCr and PDE/PCr showed statistically significant differences between each brain lesion groups (p < 0.05). The astrocytoma showed an increased PME/PDE and PME/PCr ratio. The ratios of PDE/Pi, PME/PCr, and PDE/PCr in lymphoma group were lower than those in the control group and astrocytoma group. The metastasis group showed an increased PME/PDE ratio, compared with that in the normal control group.
Conclusion: We have obtained the clinically applicable (31)P MRS, and the pH, PME/PDE, PDE/Pi, PME/PCr, and PDE/PCr ratios are helpful for differentiating among the different types of brain tumors.
Keywords: Brain; MRS; Magnetic resonance imaging; Tumor.
Figures
References
-
- Stubbs M, Rodrigues LM, Gusterson BA, Griffiths JR. Monitoring tumor growth and regression by 31P magnetic resonance spectroscopy. Adv Enzyme Regul. 1990;30:217–230. - PubMed
-
- Podo F, Canevari S, Canese R, Pisanu ME, Ricci A, Iorio E. MR evaluation of response to targeted treatment in cancer cells. NMR Biomed. 2011;24:648–672. - PubMed
-
- Cohen JS. Phospholipid and energy metabolism of cancer cells monitored by 31P magnetic resonance spectroscopy: possible clinical significance. Mayo Clin Proc. 1988;63:1199–1207. - PubMed
-
- Lehnhardt FG, Röhn G, Ernestus RI, Grüne M, Hoehn M. 1H- and (31)P-MR spectroscopy of primary and recurrent human brain tumors in vitro: malignancy-characteristic profiles of water soluble and lipophilic spectral components. NMR Biomed. 2001;14:307–317. - PubMed
Publication types
MeSH terms
Substances
LinkOut - more resources
Full Text Sources
Other Literature Sources
Medical
Research Materials
Miscellaneous
