. 2013 May 14;8(5):e63002.
doi: 10.1371/journal.pone.0063002. Print 2013.

Assessment and in vivo scoring of murine experimental autoimmune uveoretinitis using optical coherence tomography

Affiliations

Assessment and in vivo scoring of murine experimental autoimmune uveoretinitis using optical coherence tomography

Colin J Chu et al. PLoS One. .

Abstract

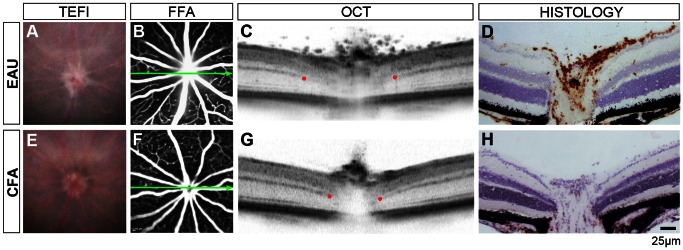
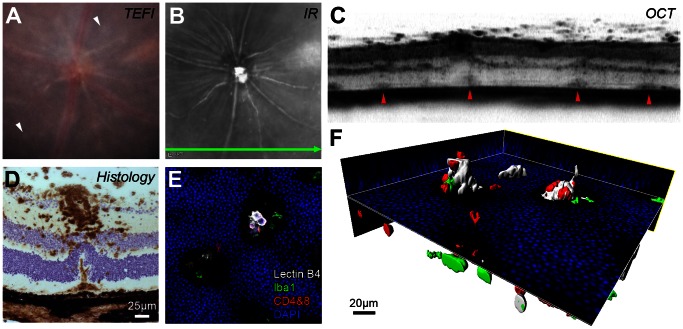
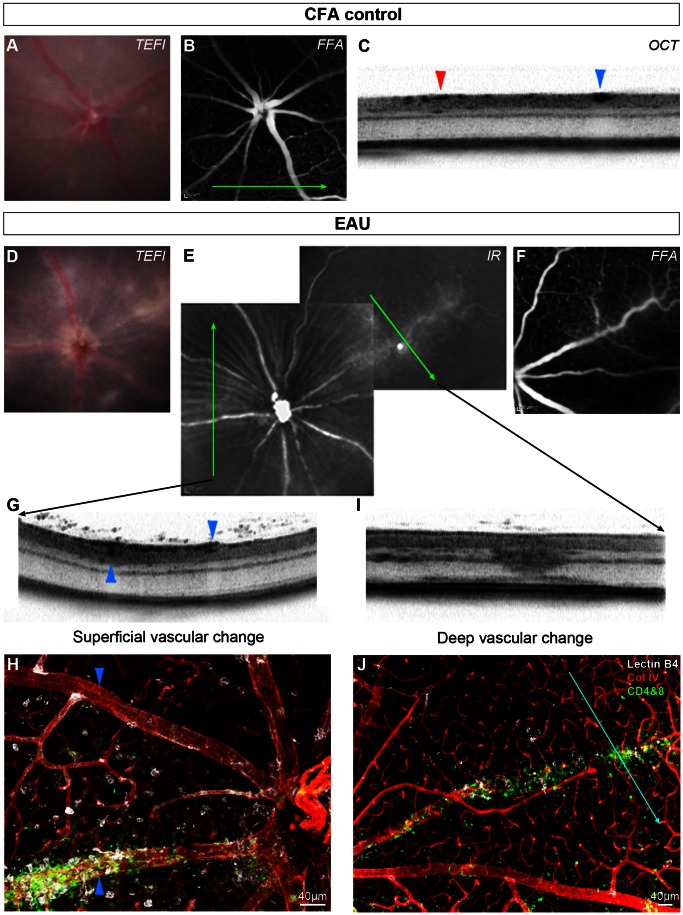
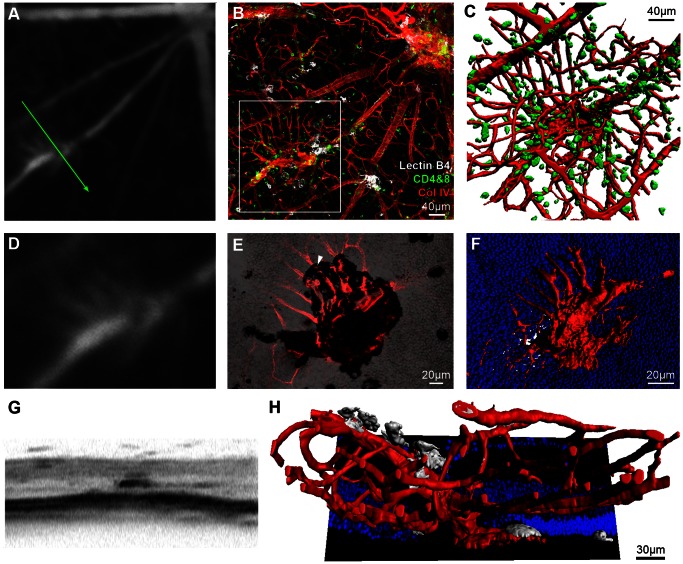
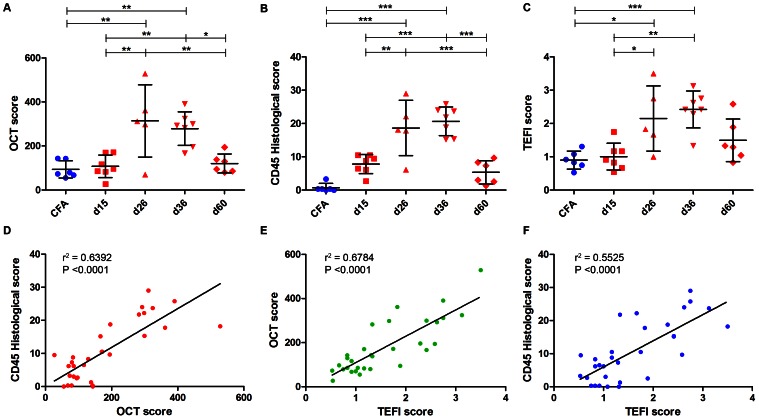
Despite advances in clinical imaging and grading our understanding of retinal immune responses and their morphological correlates in experimental autoimmune uveoretinitis (EAU), has been hindered by the requirement for post-mortem histology. To date, monitoring changes occurring during EAU disease progression and evaluating the effect of therapeutic intervention in real time has not been possible. We wanted to establish whether optical coherence tomography (OCT) could detect intraretinal changes during inflammation and to determine its utility as a tool for accurate scoring of EAU. EAU was induced in C57BL/6J mice and animals evaluated after 15, 26, 36 and 60 days. At each time-point, contemporaneous Spectralis-OCT scanning, topical endoscopic fundal imaging (TEFI), fundus fluorescein angiography (FFA) and CD45-immunolabelled histology were performed. OCT features were further characterised on retinal flat-mounts using immunohistochemistry and 3D reconstruction. Optic disc swelling and vitreous opacities detected by OCT corresponded to CD45+ cell infiltration on histology. Vasculitis identified by FFA and OCT matched perivascular myeloid and T-cell infiltrates and could be differentiated from unaffected vessels. Evolution of these changes could be followed over time in the same eye. Retinal folds were visible and found to encapsulate mixed populations of activated myeloid cells, T-cells and microglia. Using these features, an OCT-based EAU scoring system was developed, with significant correlation to validated histological (Pearson r(2) = 0.6392, P<0.0001, n = 31 eyes) and TEFI based scoring systems (r(2) = 0.6784, P<0.0001). OCT distinguishes the fundamental features of murine EAU in vivo, permits dynamic assessment of intraretinal changes and can be used to score disease severity. As a result, it allows tissue synchronisation with subsequent cellular and functional assessment and greater efficiency of animal usage. By relating OCT signals with immunohistochemistry in EAU, our findings offer the opportunity to inform the interpretation of OCT changes in human uveitis.


Conflict of interest statement

Competing Interests: The authors have declared that no competing interests exist.

Figures

Figure 1
Figure 1. EAU in the C57BL/6J mouse induces optic nerve head changes detectable on OCT.
Representative images from an eye 15 days post-induction of EAU (A–D) and matched CFA control (E–H) using four modalities. Blurred optic disc margins on TEFI (A) and disc hyperfluorescence on FFA (B) are seen in EAU. Green arrows show the location and orientation of the OCT scan. Red dots indicate where the discrete signal from the outer plexiform layer becomes obscured by disc enlargement, as a landmark to compare between eyes. Note a wider separation and vitreous opacities in EAU (C). Matched histology demonstrates CD45+ infiltration (DAB in brown with haematoxylin counterstain) during EAU (D). With TEFI alone (E), it is possible that changes in disc appearance would erroneously be identified as disease with infiltration in the CFA control, as OCT and immunohistochemistry do not corroborate any evidence of disease.
Figure 2
Figure 2. Abnormal OCT signals in vivo correspond to structural changes and associated cellular infiltrates.
Images from an eye 80 days post-induction of EAU (A–C) can be interpreted using matched ex vivo histology (D–F). On TEFI (A) multiple pale retinal lesions (white arrowheads) are present. The infrared (IR) image (B) marks the position and orientation of the simultaneously obtained OCT scan (C). Focal changes at the level of the subretinal space/deep retina correspond to the observed lesions (red arrowheads). (D) Note the CD45+ cellular infiltrate (DAB in brown with haematoxylin counterstain) around the superficial vessel and under the displaced outer nuclear layer. A limited projection image (E) and 3D reconstruction (F) of the stained retinal flat-mount identifies these lesions as folds in the outer nuclear layer containing T cell - CD4+ & CD8+ (red), myeloid - lectin B4 binding (white) and Iba1+ (green) cell populations protruding from the subretinal space (DAPI in blue). Movie S1 shows an animated version of this panel.
Figure 3
Figure 3. OCT identifies vascular changes in EAU and appearances are altered by depth and degree of infiltration.
This CFA control eye has normal TEFI (A) and FFA (B) appearances. The green arrow indicates the orientation and position of the OCT scan (C), which transects a superficial retinal arteriole (red arrowhead) and vein (blue arrowhead). Matched images from an eye at day 36 post-induction of EAU demonstrate the range of changes (D–J). Corresponding disc swelling and vascular changes are seen on TEFI (D) and infrared SLO (E), with mild leakage on FFA (F). Green arrows indicate the location and orientation of OCT scans. One scan transects two large vessels travelling near the retinal surface (G). The vessel (collagen IV in red) with altered OCT signal in the perivascular tissue (upward pointing arrowheads) is densely infiltrated with myeloid - lectin B4 binding (white) and T cell - CD4+ & CD8+ (green) cells as shown by immunohistochemistry on retinal flat mount (H). This is in contrast to the other vessel (downward pointing arrowheads), which lacks any localised infiltrate. Diffuse hyper-reflective signal on OCT (I) corresponds to a deep retinal vein, with associated cellular infiltrate (J). The blue line indicates alignment with the OCT scan.
Figure 4
Figure 4. OCT imaging can guide identification and characterisation of novel features within the EAU model.
Fundus fluorescein angiography (FFA) on an eye 36 days post-induction of EAU revealed an abnormality initially thought to lie within the pre-defined spectrum of vasculitis (A). Retinal flat-mount revealed an atypical vascular lesion arising along the course of a large vessel (B). 3D reconstruction of the region enclosed by the white box, with CD4+ & CD8+ cells (green) displayed (C). Magnified view of the FFA (D) correlates with a combined collagen IV (red) and brightfield projection image viewed from the subretinal space towards the vitreous (E). Note the black patch corresponding to RPE adherence during retinal separation. Vessels pass through this region (example indicated by white arrowhead) having arisen from the retina after penetrating the outer nuclear layer (nuclei in blue) - highlighted in the reconstruction (F). OCT demonstrates a unique, dense signal appearance (G), inconsistent with more widely observed vasculitic changes in EAU. The arrangement seen on sagittal reconstruction (H) might partly explain the appearance, which could be consistent with inflammatory induced intraretinal telangiectasia, vascular reorganisation or neovascular buds. Lectin B4 staining is displayed (white). The green arrow indicates the location and orientation of the OCT scan. See Movie S2 for an animated 3D reconstruction.
Figure 5
Figure 5. OCT-based EAU severity scoring correlates well with established measures and routine use should be considered.
Absolute scores for the combined cohort at each time-point from day 15 to day 60 post-induction of EAU for OCT (A), histology (B) and TEFI (C). Each point shows the average of scores from three, masked, trained assessors. n = 31 eyes, treated independently by one-way ANOVA (P<0.0002 for each), with Tukey post hoc test for multiple comparison (* = P<0.05, ** = P<0.01, *** = P<0.001). SD are shown. Pearson correlations and linear regression of the values are displayed for comparisons between OCT and histological (D), TEFI and OCT (E) and TEFI and histological scores (F). Correlations are significant and correlate well between each other.

References

    1. Caspi RR, Silver PB, Luger D, Tang J, Cortes LM, et al. (2008) Mouse models of experimental autoimmune uveitis. Ophthalmic Res 40: 169–174. - PMC - PubMed
    1. Schewitz-Bowers LP, Lee RW, Dick AD (2010) Immune mechanisms of intraocular inflammation. Ex Rev Op 5: 43–58.
    1. Horai R, Caspi RR (2011) Cytokines in Autoimmune Uveitis. Journal of Interferon & Cytokine Research. doi:10.1089/jir.2011.0042. - PMC - PubMed
    1. Calder CJ, Nicholson LB, Dick AD (2005) A selective role for the TNF p55 receptor in autocrine signaling following IFN-gamma stimulation in experimental autoimmune uveoretinitis. J Immunol 175: 6286–6293. - PubMed
    1. Raveney BJE, Copland DA, Dick AD, Nicholson LB (2009) TNFR1-dependent regulation of myeloid cell function in experimental autoimmune uveoretinitis. J Immunol 183: 2321–2329. - PubMed

Publication types