. 2013 May 17;8(5):e63583.
doi: 10.1371/journal.pone.0063583. Print 2013.

A simple high-content cell cycle assay reveals frequent discrepancies between cell number and ATP and MTS proliferation assays

Affiliations

A simple high-content cell cycle assay reveals frequent discrepancies between cell number and ATP and MTS proliferation assays

Grace Ka Yan Chan et al. PLoS One. .

Abstract

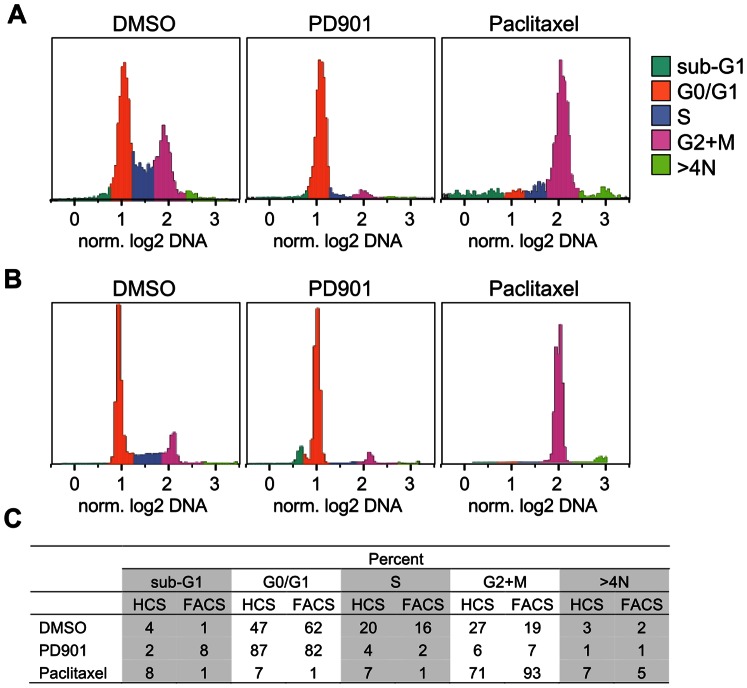
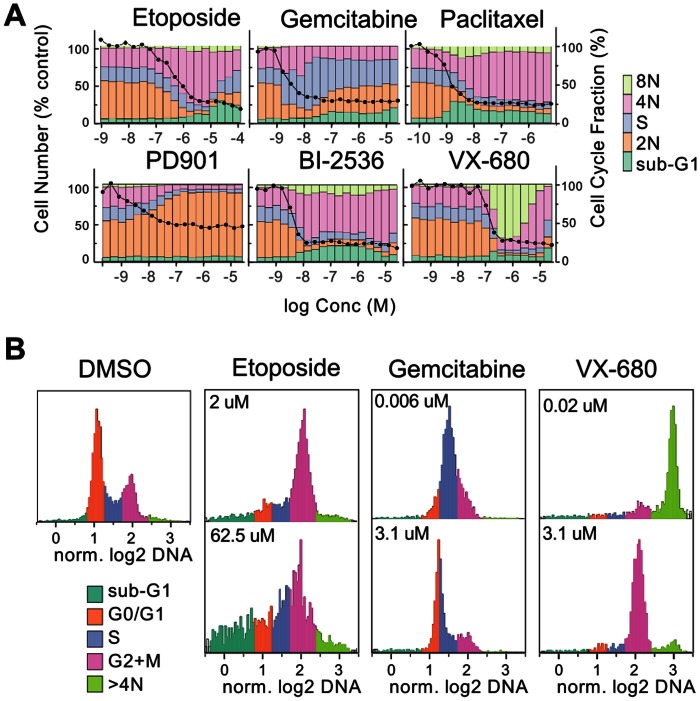
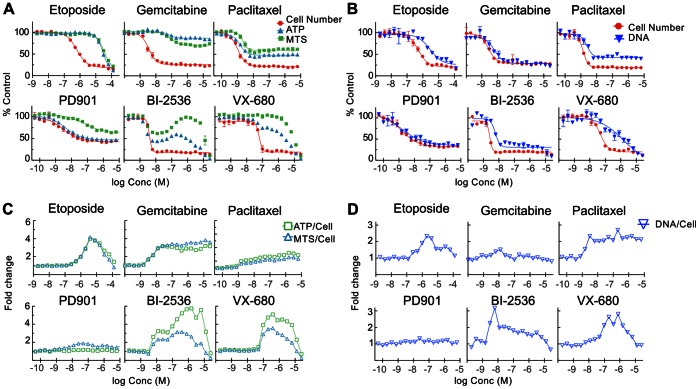
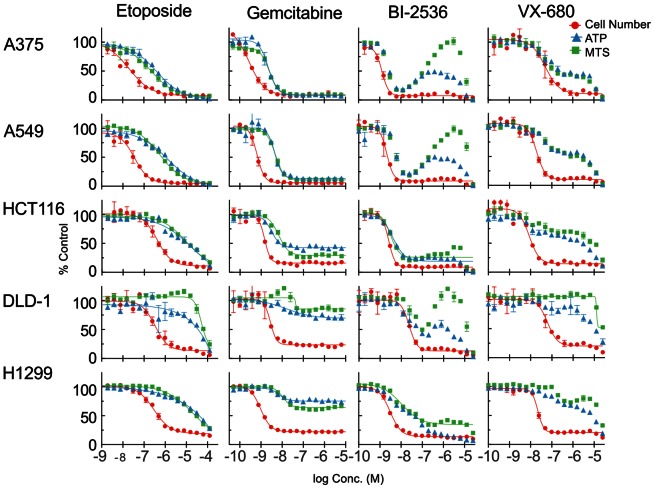
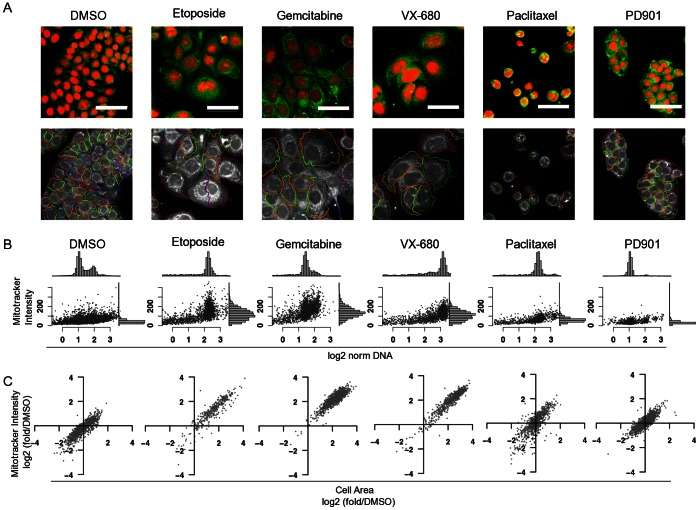
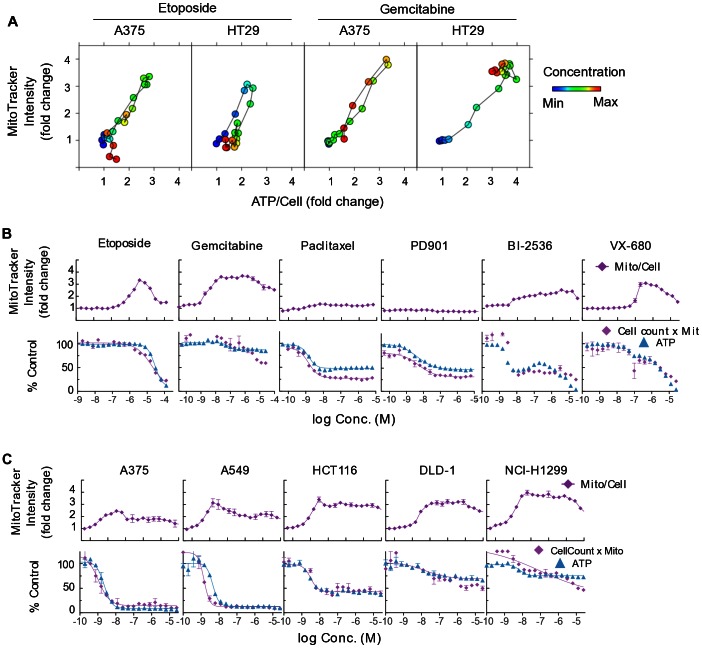
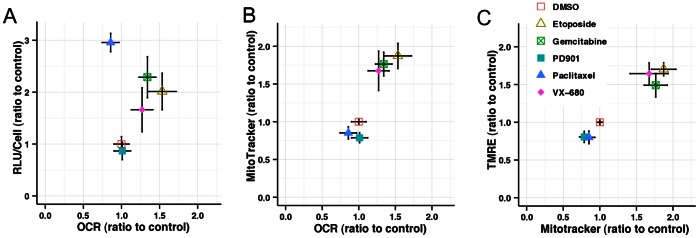
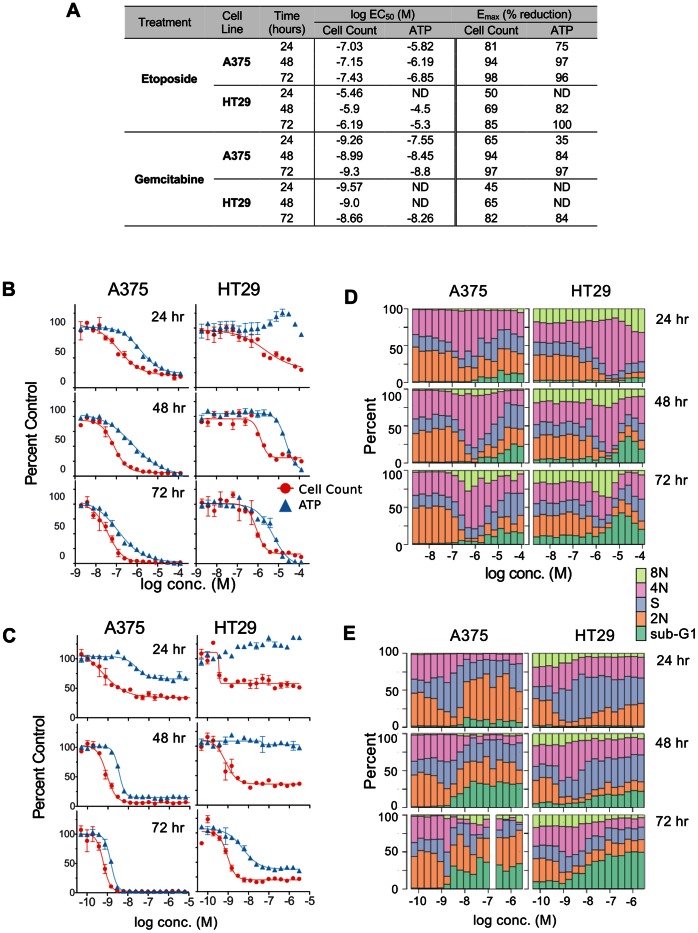
In order to efficiently characterize both antiproliferative potency and mechanism of action of small molecules targeting the cell cycle, we developed a high-throughput image-based assay to determine cell number and cell cycle phase distribution. Using this we profiled the effects of experimental and approved anti-cancer agents with a range mechanisms of action on a set of cell lines, comparing direct cell counting versus two metabolism-based cell viability/proliferation assay formats, ATP-dependent bioluminescence, MTS (3-(4,5-dimethylthiazol-2-yl)-5-(3-carboxymethoxyphenyl)-2-(4-sulfophenyl)-2H-tetrazolium) reduction, and a whole-well DNA-binding dye fluorescence assay. We show that, depending on compound mechanisms of action, the metabolism-based proxy assays are frequently prone to 1) significant underestimation of compound potency and efficacy, and 2) non-monotonic dose-response curves due to concentration-dependent phenotypic 'switching'. In particular, potency and efficacy of DNA synthesis-targeting agents such as gemcitabine and etoposide could be profoundly underestimated by ATP and MTS-reduction assays. In the same image-based assay we showed that drug-induced increases in ATP content were associated with increased cell size and proportionate increases in mitochondrial content and respiratory flux concomitant with cell cycle arrest. Therefore, differences in compound mechanism of action and cell line-specific responses can yield significantly misleading results when using ATP or tetrazolium-reduction assays as a proxy for cell number when screening compounds for antiproliferative activity or profiling panels of cell lines for drug sensitivity.


Conflict of interest statement

Competing Interests: GKYC, TLK and JGM hold stock in Roche. All authors are employees of Genentech, a member of the Roche Group. There are no patents, products in development or marketed products to declare. This does not alter the authors' adherence to all the PLOS ONE policies on sharing data and materials.

Figures

Figure 1
Figure 1. High-content cell cycle analysis.
HT29 cells treated for 48 hours with the indicated treatments in a 384-well plate were fixed and stained with Hoechst 33452, imaged, and integrated staining intensity of individual nuclei was estimated as described in Materials and Methods. A. DNA content histograms for log-2 transformed DNA intensity values normalized to the modal value of the 2N DNA. Automatic classification into sub-G1, 2N, S-phase, 4N and 8N populations is indicated. B. DNA content histograms acquired by flow cytometry, raw FL2-A data was normalized and binned in the same way as high-content data. C. Quantitation of the sub-population fractions of the histograms.
Figure 2
Figure 2. Cell cycle profiles derived from high-content assay.
Cells in the same images used for direct cell counting were classified into five cell cycle bins by integrated DNA intensity. A. Stacked bars show the relative frequencies of the sub-populations at the indicated concentrations. Each bar is the average of two wells. Black circles indicate relative cell number. B. Histograms of integrated DNA intensity derived from the images from individual wells showing the change in cell cycle profile from EC90 (upper panels) to higher doses of etoposide, gemcitabine and VX-680.
Figure 3
Figure 3. Comparison of ATP and MTS assays with direct cell counting.
Replicate plates of HT29 cells were treated as indicated for 48 hours then analyzed by ATP or MTS assay or high-content cell counting. A. Normalized values for direct cell number (red circles), ATP assay (RLU) (blue triangles) and MTS assay (E490) (green squares), lines indicate fits to 4-parameter logistic model. If no line is shown then regression did not result in a curve that met acceptance criteria. B. Normalized values for direct cell number (red circles), and DNA assay (CyQuant) (blue triangles) C. Fold change in normalized ratios of ATP RLU signal to cell number (green squares) and MTS assay signal to cell number (blue triangles)D. Fold change in normalized ratio of DNA assay signal to cell number.
Figure 4
Figure 4. Comparison of ATP and MTS assays with direct cell counting for multiple cell lines.
Replicate plates of cells were treated as indicated for 48 hours then analyzed by ATP or MTS assay or high-content cell counting. Normalized values for direct cell number (red circles), ATP assay (RLU) (blue triangles) and MTS assays (E490) (green squares), lines indicate fits to 4-parameter logistic model. If no line is shown then regression did not result in a curve meeting acceptance criteria.
Figure 5
Figure 5. Effects of compound treatment on mitochondrial mass and cell size.
HT29 cells were treated with the indicated drugs for 48 hours. (Aphidicolin; 3.1 µM, Etoposide; 3.9 µM, Gemcitabine; 24 nM, Paclitaxel; 98 nM, VX-680; 195, nM, PD901; 390 nM). A. Images of Hoechst 33452-stained DNA (red) and MitoTracker deep red-FM staining (green) were acquired with a 20x water-immersion objective as described in Methods section. All images are shown at same magnification and intensity scaling. Scale bar = 50 µm. B. MitoTracker deep red images showing identification and segmentation of cell boundaries. C. Scatter plots and histograms of log2-normalized integrated DNA intensity (x axis, upper histogram panels) and integrated cytoplasmic MitoTracker Deep Red FM staining intensity (y axis, right-side histograms) derived from the same wells as shown in part A. D. Variation in cell area and mitochondrial content (integrated MitoTracker deep red intensity) for the same cell populations, normalized as fold change relative to the mean area and intensity of DMSO-treated samples.
Figure 6
Figure 6. Drug-induced increases in mitochondrial mass correlate with increases in per-cell ATP and MTS assay signal.
A. Correlation between ATP/cell (RLU/cell number) vs mean per-cell integrated MitoTracker intensity for each point of the dose-response curves. Each point is the mean of replicate wells. Colors indicate relative concentrations in 2-fold dilutions from highest (red) to lowest (blue). Points are connected in order of concentration. B, C Upper panels show fold change in mean per-cell integrated MitoTracker staining intensity as a function of concentration. Lower panels show dose-response curves for the total mitochondrial mass, (cell number multiplied by mean per-cell MitoTracker intensity) (purple) overlaid with the ATP assay data (blue). B. HT29 cells treated with the indicated compounds. C. Different cell lines as indicated treated with gemcitabine.
Figure 7
Figure 7. Effects of drug treatment on mitochondrial function.
Basal oxygen consumption rate (OCR) determined for cells treated with the indicated compounds (etoposide, 10 µM; gemcitabine 0.1 µM; paclitaxel 0.01 µM; PD901 1 µM, VX-680 0.2 µM) were normalized for cell number. Per-cell OCR is compared with normalized ATP-generated RLU (A) and mitochondrial mass (B). Cells analyzed for mitochondrial mass by MitoTracker Deep Red staining were also stained with the mitochondrial membrane potential-sensitive dye TMRE, and the mean integrated intensities compared (C). All data were normalized as a ratio of the mean DMSO-treated values and are the mean of four replicate wells, error bars show standard deviation.
Figure 8
Figure 8. Time-dependence of discrepancies between cell number and ATP assay.
A. EC50 and Emax values HT29 and A375 cells treated with etoposide or gemcitabine for the indicated periods of time were assayed by ATP and high-content assays as described. ND, not determined – no valid curve fit was possible by the standard acceptance criteria described in methods. Assay dose-response curves (B,C) and cell cycle profiles (D,E) for A375 and HT29 cells treated with etoposide (B,D) and gemcitabine (C,E).

References

    1. Quent VMC, Loessner D, Friis T, Reichert JC, Hutmacher DW (2010) Discrepancies between metabolic activity and DNA content as tool to assess cell proliferation in cancer research. J Cell Mol Med 14: 1003–1013 doi:10.1111/j.1582-4934.2010.01013.x. - DOI - PMC - PubMed
    1. Crouch SP, Kozlowski R, Slater KJ, Fletcher J (1993) The use of ATP bioluminescence as a measure of cell proliferation and cytotoxicity. J Immunol Methods 160: 81–88. - PubMed
    1. Mueller H, Kassack MU, Wiese M (2004) Comparison of the usefulness of the MTT, ATP, and calcein assays to predict the potency of cytotoxic agents in various human cancer cell lines. J Biomol Screen 9: 506–515 doi:10.1177/1087057104265386. - DOI - PubMed
    1. Hannah R, Beck M (2001) Celltiter-Glo™ Luminescent Cell Viability Assay: A Sensitive And Rapid Method For Determining Cell Viability. Promega Cell Notes.
    1. Berridge M, Herst P, Tan A (2005) Tetrazolium dyes as tools in cell biology: New insights into their cellular reduction. BIOTECHNOLOGY ANNUAL REVIEW 11: 127–152 doi:10.1016/S1387-2656(05)11004-7. - DOI - PubMed

Publication types