. 2013 May 17;8(5):e63910.
doi: 10.1371/journal.pone.0063910. Print 2013.

Trends in the prevalence of tuberous sclerosis complex manifestations: an epidemiological study of 166 Japanese patients

Affiliations

Trends in the prevalence of tuberous sclerosis complex manifestations: an epidemiological study of 166 Japanese patients

Mari Wataya-Kaneda et al. PLoS One. .

Abstract

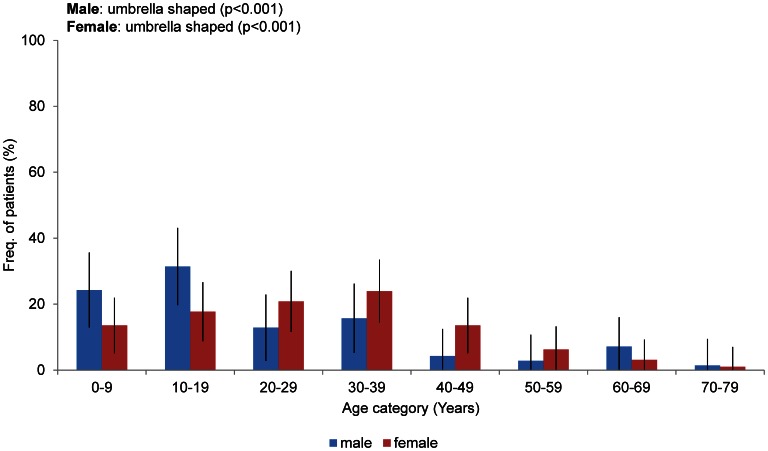
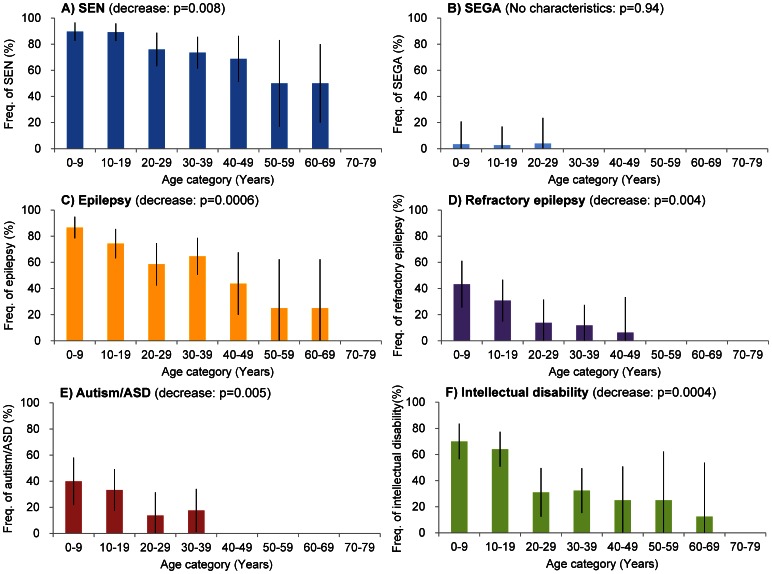
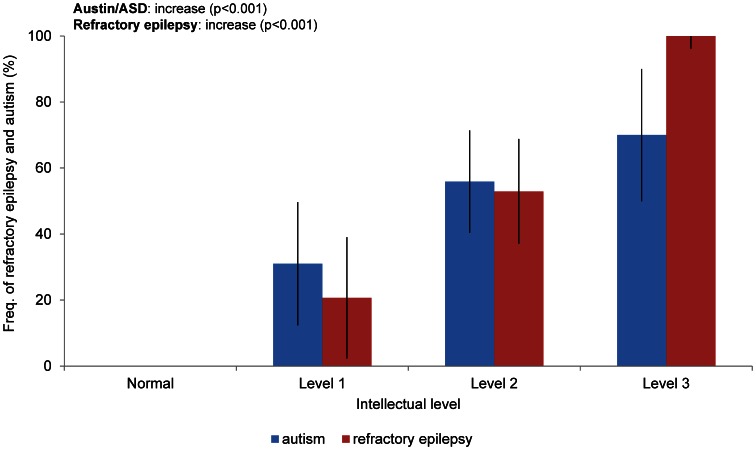
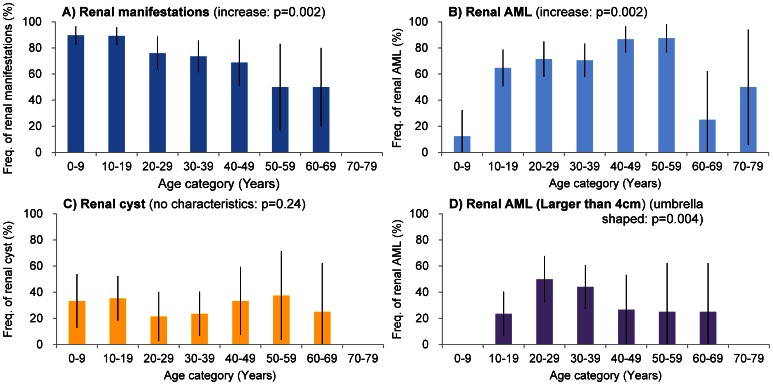
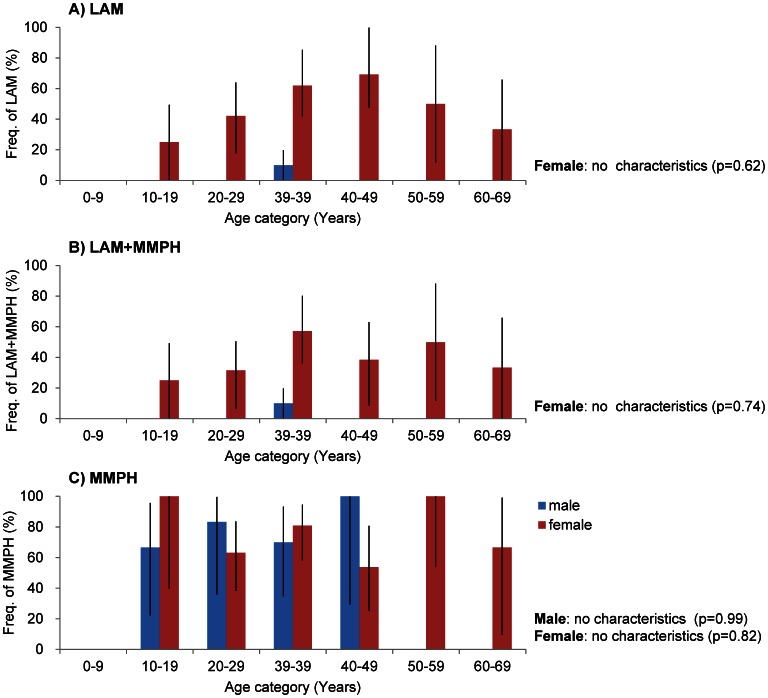
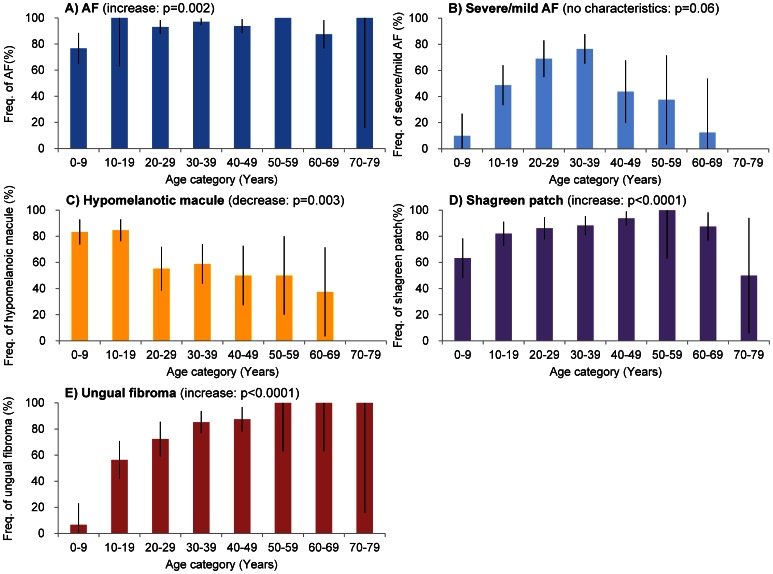
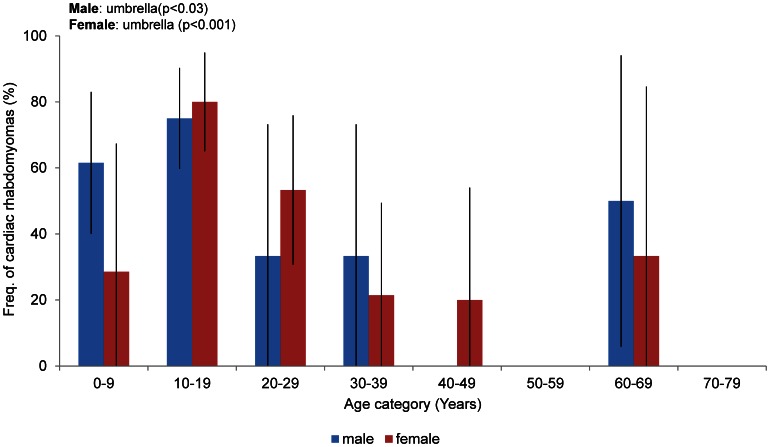
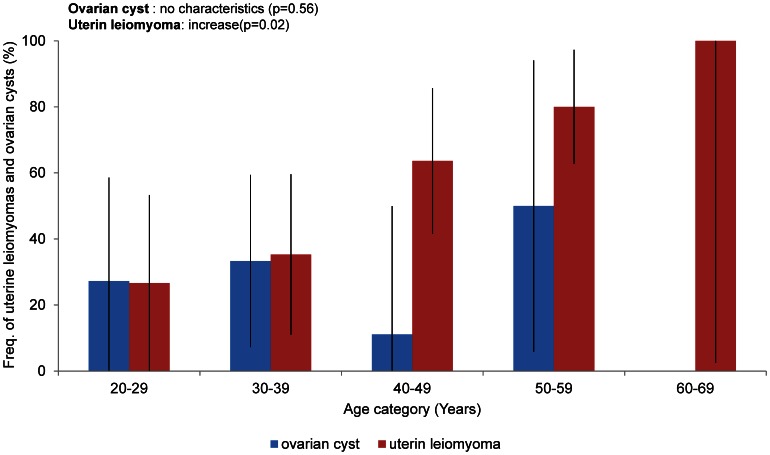
Tuberous sclerosis complex (TSC) is an autosomal dominant disorder with multi-system involvement and variable manifestations. There has been significant progress in TSC research and the development of technologies used to diagnose this disorder. As a result, individuals with mild TSC are now being diagnosed, including many older adults who have not developed seizures or cognitive abnormalities. We conducted a statistical analysis of the frequency of TSC manifestations in a population of Japanese adults and children, comparing our findings with historical data. The chi-square test was used to examine the frequency of each manifestation by age. A total of 166 outpatients at the Department of Dermatology of Osaka University Hospital during the period from January 2001 to March 2011 were included in the study. Compared to previous reports, the frequency of neurologic manifestations (excepting autism) was lower in this cohort, and the frequency of skin manifestations (excepting hypomelanotic macules) was higher in this cohort. The frequencies of pulmonary lymphangioleiomyomatosis and renal manifestations were not significantly different from those previously reported. Regarding the association of each manifestation with age, the frequency of neurologic manifestations (excepting subependymal giant cell astrocytoma) was significantly higher in younger patients than in older patients. The frequency of skin manifestations and renal angiomyolipoma were significantly higher in older patients than in younger patients. Because of their high frequency and visibility, skin manifestations are useful in the diagnosis of TSC. Moreover, uterine perivascular epithelioid cell tumor was also characterized as a new findings associated with TSC.


Conflict of interest statement

Competing Interests: The authors have declared that no competing interests exist.

Figures

Figure 1
Figure 1. Age and gender of the 166 individuals in the study population.
The rates indicate the percentages of patients in each age group. The bars indicate the confidence interval (CI).
Figure 2
Figure 2. Frequency of neuronal manifestations in each age group.
The rates of A) subependymal nodule (SEN: blue), B) subependymal giant cell astrocytoma (SEGA; light blue), C) epilepsy (orange), D) refractory epilepsy (purple), E) autism/ASD (red) and F) intellectual disabilities (green) in each age group are shown. Intellectual disabilities include any degree of disability. SEGA and refractory epilepsy were defined as described in the text. The rates indicate the percentages of patients with each manifestation in each age group. The bars indicate the confidence interval (CI).
Figure 3
Figure 3. Association of refractory epilepsy and autism/ASD with intellectual disabilities.
Frequency (%) of patients with refractory epilepsy (red column) and autism/ASD (blue column) at each intellectual level are shown. The statistical analyses of refractory epilepsy and autism/ASD in relation to intellectual disability were examined using the chi-square test, and the generalized logistic models showed significance at p<0.001. The bars indicate the CI.
Figure 4
Figure 4. Frequency of renal manifestations, different-sized renal angiomyolipomas and cysts in each age group.
The frequency (%) of patients with A) renal manifestations (blue), B) renal AML (angiomyolipomas: light blue), C) renal cysts (yellow) and D) renal AML larger than 4 cm (purple), as stratified by age. Renal manifestations include any renal symptom. Renal AML includes any sized renal AML. The frequency (%) of patients with each manifestation in each examined age group. The bars indicate the CI.
Figure 5
Figure 5. Frequency of each pulmonary manifestation stratified by age and gender.
LAM and MMPH stand for lymphangioleiomyomatosis and multifocal micronodular pneumocyte hyperplasia, respectively. A) The frequency of patients with LAM with/without MMPH, B) with both LAM and MMPH and C) with MMPH with/without LAM by age and gender are shown. The blue column indicates males, and the red column indicates females. The frequency (%) of patients with each manifestation in each examined age group. The bars indicate the CI.
Figure 6
Figure 6. Trends in the age-specific frequency of each skin manifestation.
The frequency indicates the proportion of patients in each age group with A) FA (facial angiofibromas: blue), B) severe and mild FA (light blue), C) hypomelanotic macules (yellow), D) shagreen patches (purple) and E) ungual fibromas (red). The angiofibromas were divided into three classes, slight, mild and severe, as described in the text. AF includes angiofibromas of all classes. The bars indicate the CI.
Figure 7
Figure 7. Frequency of cardiac rhabdomyomas stratified by age and gender.
The rates indicate the percentages of female patients with cardiac rhabdomyomas (red) and male patients with cardiac rhabdomyomas (blue). The bars indicate the CI.
Figure 8
Figure 8. Frequency of uterine leiomyomas and ovarian cysts in each age group.
Fifty-one and 39 female patients over 20 years of age were examined for uterine leiomyomas and ovarian cysts, respectively. The rates indicate the proportions of patients in each age group with uterine leiomyomas (red) and ovarian cysts (blue). The bars indicate the CI.

References

    1. Osborne JP, Jones AC, Burley MW, Jeganathan D, Young J, et al. (2000) Non-penetrance in tuberous sclerosis. Lancet 355: 1698. - PubMed
    1. van Slegtenhorst M, de Hoogt R, Hermans C, Nellist M, Janssen B, et al. (1997) Identification of the tuberous sclerosis gene TSC1 on chromosome 9q34. Science 277: 805–808. - PubMed
    1. Identification and characterization of the tuberous sclerosis gene on chromosome 16. Cell 75: 1305–1315. - PubMed
    1. Chu-Shore CJ, Major P, Camposano S, Muzykewicz D, Thiele EA (2010) The natural history of epilepsy in tuberous sclerosis complex. Epilepsia 51: 1236–1241. - PMC - PubMed
    1. Jones AC, Shyamsundar MM, Thomas MW, Maynard J, Idziaszczyk S, et al. (1999) Comprehensive mutation analysis of TSC1 and TSC2-and phenotypic correlations in 150 families with tuberous sclerosis. Am J Hum Genet 64: 1305–1315. - PMC - PubMed

Publication types