. 2013 May 14;8(5):e64521.
doi: 10.1371/journal.pone.0064521. Print 2013.

Amyloid precursor protein is an autonomous growth cone adhesion molecule engaged in contact guidance

Affiliations

Amyloid precursor protein is an autonomous growth cone adhesion molecule engaged in contact guidance

Lucas J Sosa et al. PLoS One. .

Abstract

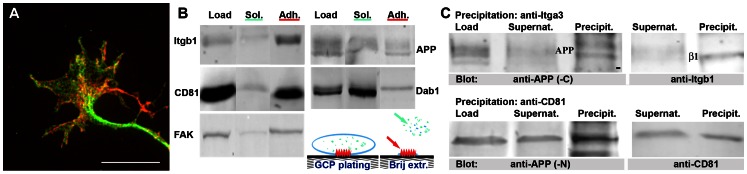
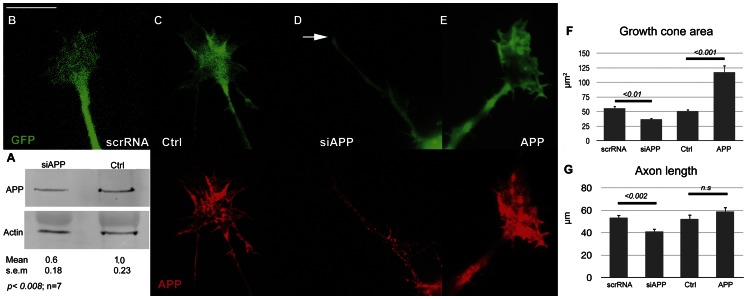
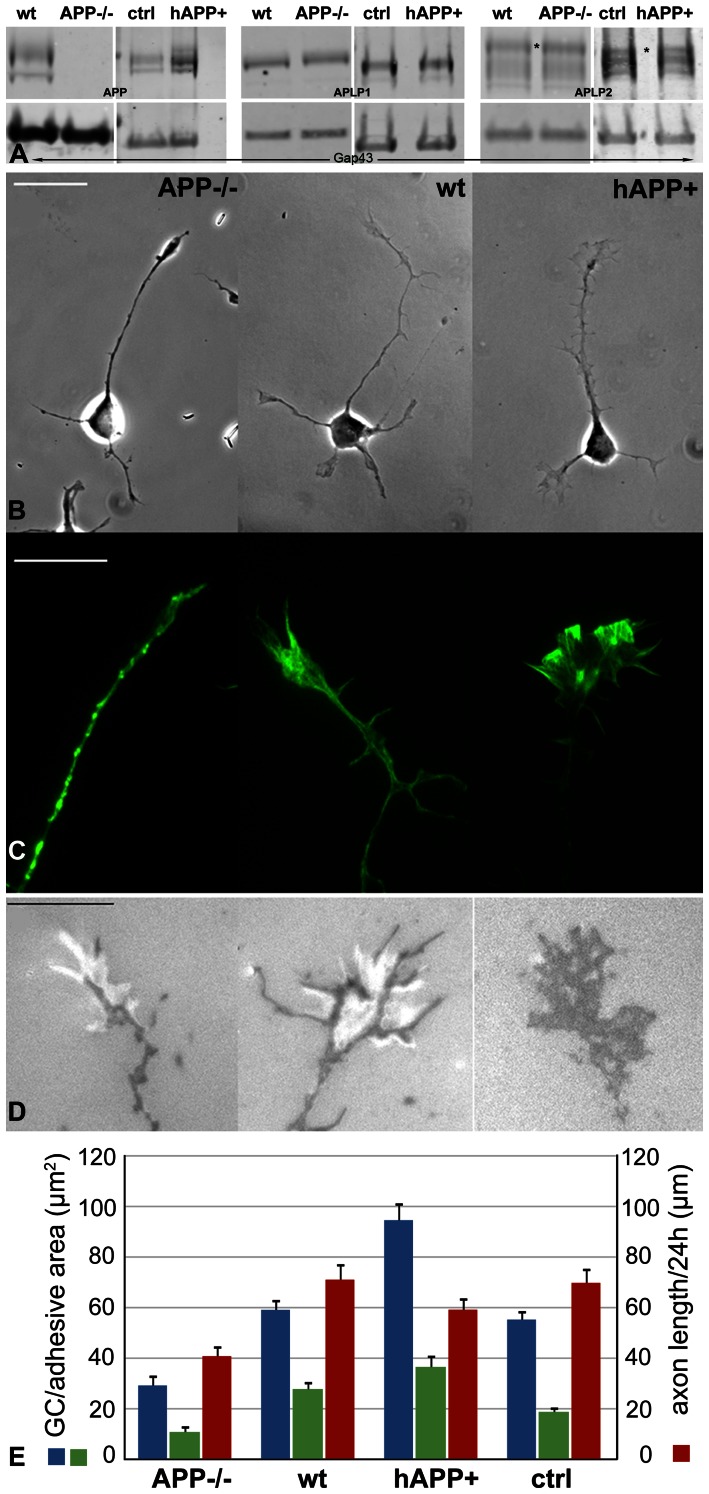
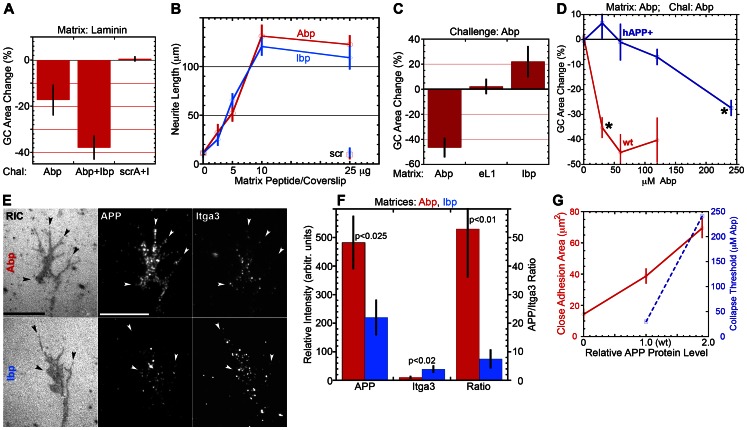
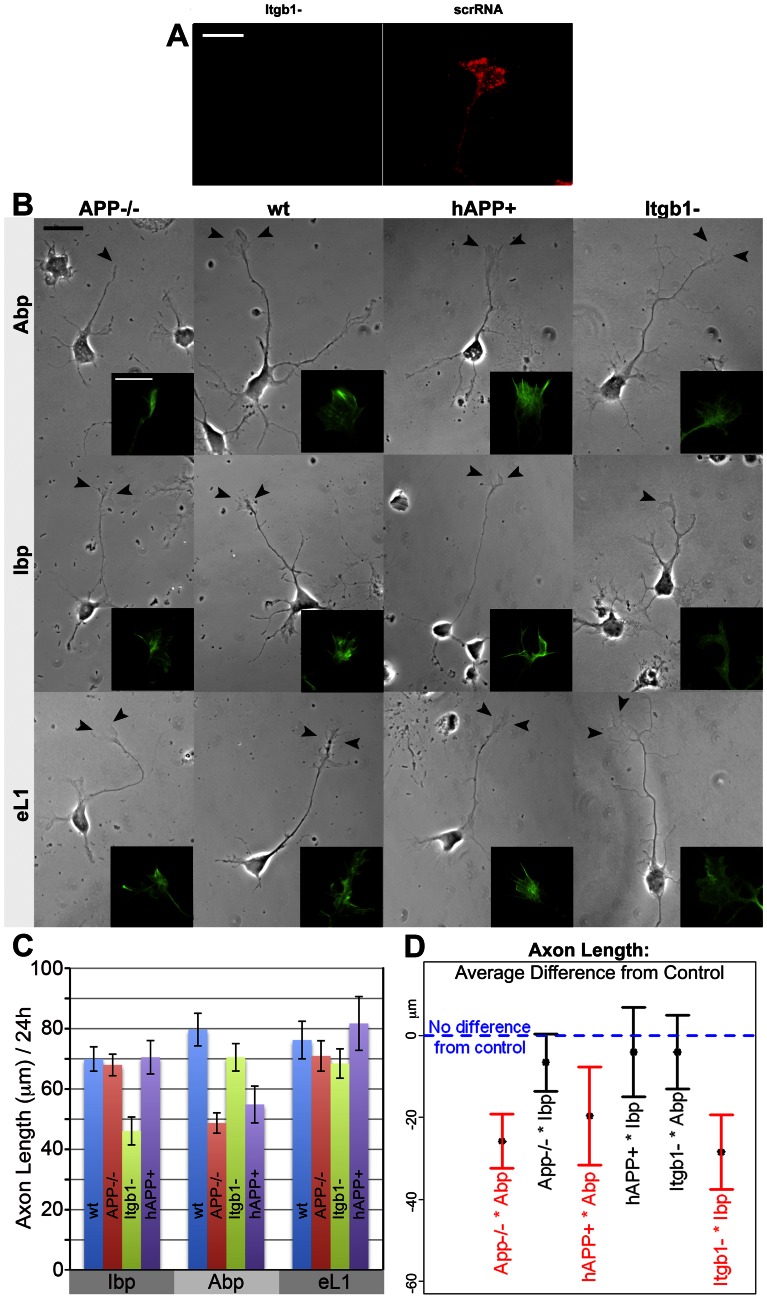
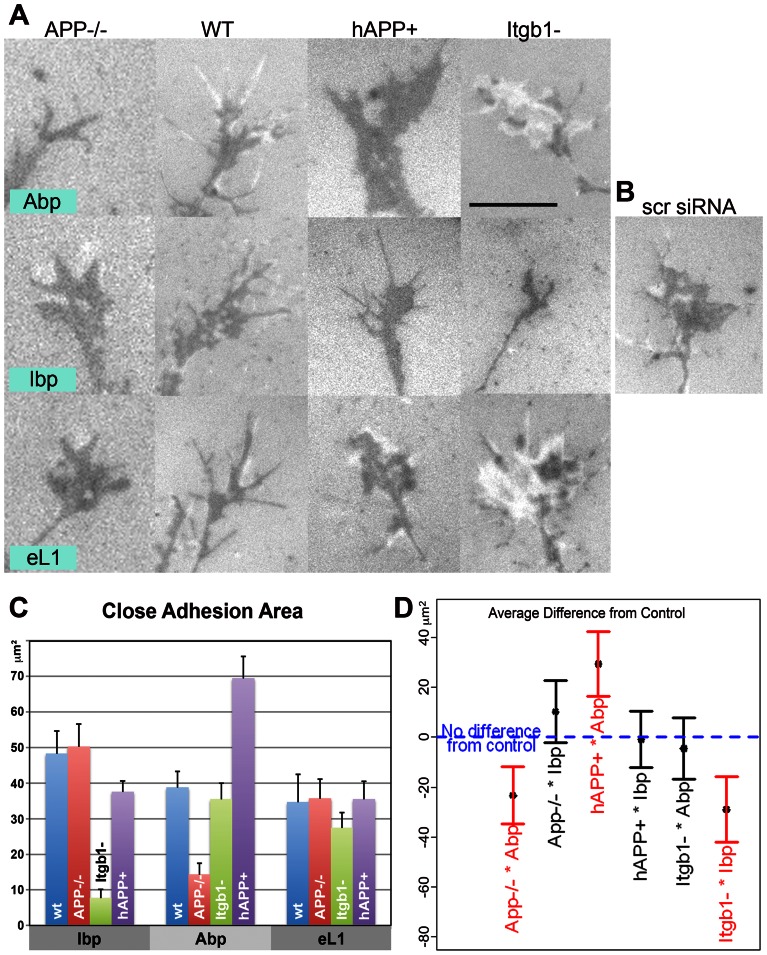
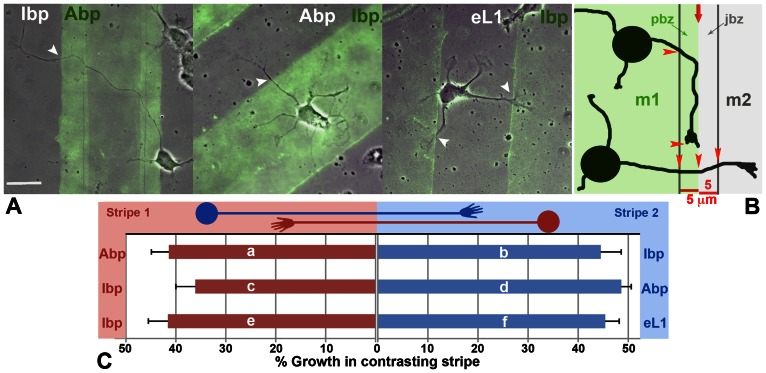
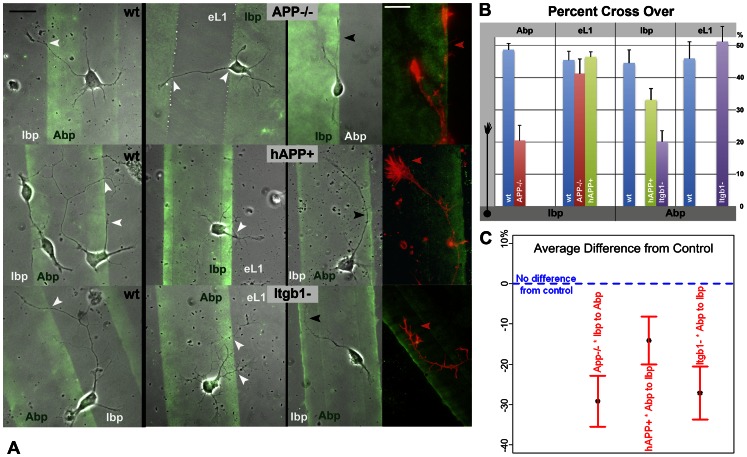
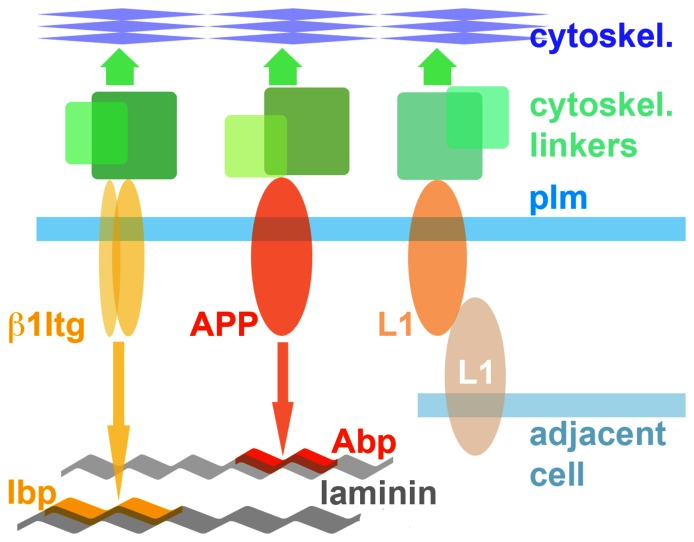
Amyloid precursor protein (APP), a transmembrane glycoprotein, is well known for its involvement in the pathogenesis of Alzheimer disease of the aging brain, but its normal function is unclear. APP is a prominent component of the adult as well as the developing brain. It is enriched in axonal growth cones (GCs) and has been implicated in cell adhesion and motility. We tested the hypothesis that APP is an extracellular matrix adhesion molecule in experiments that isolated the function of APP from that of well-established adhesion molecules. To this end we plated wild-type, APP-, or β1-integrin (Itgb1)- misexpressing mouse hippocampal neurons on matrices of either laminin, recombinant L1, or synthetic peptides binding specifically to Itgb1 s or APP. We measured GC adhesion, initial axonal outgrowth, and substrate preference on alternating matrix stripes and made the following observations: Substrates of APP-binding peptide alone sustain neurite outgrowth; APP dosage controls GC adhesion to laminin and APP-binding peptide as well as axonal outgrowth in Itgb1- independent manner; and APP directs GCs in contact guidance assays. It follows that APP is an independently operating cell adhesion molecule that affects the GC's phenotype on APP-binding matrices including laminin, and that it is likely to affect axon pathfinding in vivo.


Conflict of interest statement

Competing Interests: The authors have declared that no competing interests exist.

Figures

Figure 1
Figure 1. Presence of APP in GC adhesions.
A. Immunofluorescence image of an axonal GC on laminin, fixed after 24 h in vitro and labeled with anti-APP (red) and anti-Itga3 (green). Note substantial overlap (yellow). Calibration, 10 µm. B. Isolation of GC adhesions on laminin. Rat GCPs plated on laminin were extracted with Brij98 to yield the unattached soluble fraction (see cartoon, green and blue; Sol). The remaining adherent structures (Adh, red) were recovered with SDS. The fractions were analyzed by western blot (equal fractional protein amounts loaded). Samples not extracted with Brij98 served as controls. The adhesion markers Itgb1, CD81 and FAK were enriched in the adherent fraction compared to its soluble counterpart, and significant amounts of APP and Dab1 (upper band) were detected. C. Co-immunoprecipitation of APP with Itga3 and CD81. The blots on the left show the enrichment of APP in the precipitates (N- or C-terminus-specific antibodies), while those on the right show precipitated Itgb1 (β1) and CD81.
Figure 2
Figure 2. APP misexpression in wt mouse neurons on laminin.
A. Western blot of hippocampal cultures treated with APP-targeted siRNA (siAPP) versus control siRNA. siAPP reduces the total APP level significantly (densitometric analysis: arbitrary values normalized to control; actin, loading control). B–E. Fluorescence images of neurons (24 h in vitro) transfected with GFP vector plus (left to right): scrambled siRNA (scrRNA), vehicle (Ctrl), siAPP, or APP vector, respectively. Top row, GFP fluorescence; bottom row, APP fluorescence. Arrow, fusiform GC. Scale bar 10 µm. F, G. GC area and axon length (means ± s.e.) in transfected neurons at 24 h in vitro. Horizontal bars, p values in two-sample t tests. n.s., not significant.
Figure 3
Figure 3. GC size, adhesion and advance of APP mutant neurons on laminin.
A. Western blots of GCPs isolated from newborn brain of wt and mutant mice. Blots were probed for APP (Mr ∼100 kDa), APLP1 (Mr  = 72 kDa), and APLP2 (Mr  = 87 kDa, asterisk) and for Gap43 as loading control. APLP1 and APLP2 levels were the same in wt and mutant mice. B. Phase contrast images of wt and mutant neurons and (C) TIRF images of their GCs labeled with fluorescent phalloidin. D. RICM images of live GCs showing close adhesions (dark) and wide contacts (bright). hAPP+ control GCs (ctrl; non-transgenic siblings) were the same as wt and, therefore, are not shown. Scale bars, 20 µm (B) and 10 µm (C, D). E. GC area (blue), cumulative adhesive area (green) and axon length (red) at 24 h in vitro for the indicated mouse strains (means ± s.e.). For statistical analysis, see Tables 1 and 2.
Figure 4
Figure 4. GC adhesion to peptide matrices and adhesion assessment in competition experiments with soluble peptides.
A. Wt mouse neurons were grown on laminin and challenged for 10 min with approx. 37 µM each of Abp, Abp plus Ibp or scrambled Abp plus scrambled Ibp (scrA+I). Peptide-induced GC detachment is shown as area reduction (mean % change ± s.e., relative to area before challenge; n≥9). Student's t tests were: for Abp vs. Abp+Ibp and for Abp vs. scr A+I, <0.05; for Abp+Ibp vs. scrA+I, <0.0001. B. Neurite length (mean ± s.e.) at 24 h in culture, as a function of peptide deposition. Matrix peptide/coverslip, amount used for coating. scr, data points for scrambled Abp and Ibp. C. Wt mouse neurons were grown on Abp, eL1 or Ibp and challenged with 75 µM soluble Abp for 10 min. Graph shows Abp-induced change in GC area (mean % change ± s.e.). GC collapse (p<0.001; n ≥4) was observed only on Abp (Ibp was not significantly different from eL1). D. Comparison of wt and hAPP+ GCs in collapse assays on Abp (10 min challenge). GC area change (mean % ± s.e.) is shown as a function of Abp concentration applied. Asterisks mark the lowest Abp concentrations triggering significant collapse (threshold p = 0.05; actual significance, p≤3.0E-5). E. RICM and TIRF microscopy of wt GCs (grown for 24 h on Abp or Ibp) fixed, permeabilized and labeled with anti-APP and anti-Itga3. Close adhesions are co-extensive with clustering of APP and Itga3 on Abp and Ibp, respectively (arrow heads). Bars, 10 µm. F. Fluorescence intensity (mean ± s.e., n = 6) of anti-APP and anti-Itga3, and ratio of these intensities in GCs on Abp (red) and Ibp (blue). Antigen clustering is substrate-specific. Labeling intensities of APP and Itga3 cannot be compared because the antibody affinities are unknown. G. GC close adhesion area (red line; from Table 3) and collapse threshold (dashed blue line; from D) plotted relative to APP protein level (normalized to wt; see Fig. 3).
Figure 5
Figure 5. Axon length of APP mutant and Itgb1− deficient mouse neurons on monospecific substrates.
A. Knock-down of Itgb1 protein in wt GC by siItgb1 (control, scrRNA). Itgb1 fluorescence (red) was not detectable at 24 h in vitro. B. APP mutant and Itgb1− neurons on mono-specific matrices for 24 h (phase contrast). Scale 20 µm. Arrow heads point at the axonal GCs. Inserts show these GCs at higher magnification (bar 10 µm) after phalloidin labeling (APP−/−, wt, hAPP+) or to reveal the GFP transfection marker (Itgb1−). C. Axon lengths for different neurons on the three growth substrates (bottom labels) after 24 h in vitro (means ± s.e.). D. Average difference in outgrowth and associated 95% confidence interval for each neuron*matrix combination relative to the control group. Negative values indicate average growth below that of the control group. The only significantly different combinations (red) are APP−/− and hAPP+ on Abp, and Itgb1− on Ibp.
Figure 6
Figure 6. GC adhesion of APP mutant and Itgb1− deficient mouse neurons to mono-specific matrices.
A. RICM of live GCs of mutant neurons (columns) on different matrices (rows). Dark areas indicate close adhesions, bright areas are wider contacts. Scale 10 µm. Note different adhesive areas of APP−/− and hAPP+ GCs on Abp, and of the Itgb1− GC on Ibp. B. RICM image of live GC of a neuron transfected with scrambled siRNA on Ibp [control for adjacent image (Itgb1− on Ibp)]. C. Cumulative close adhesion areas of GCs in different neuron*matrix combinations (means ± s.e.). D. Average difference of close adhesion areas from control group and the associated 95% confidence intervals for the tested neuron*matrix combinations. Negative values indicate reduced and positive values indicate increased areas. Only the values for APP−/− and hAPP+ neurons on Abp, and for Itgb1− neurons on Ibp are significantly different (red).
Figure 7
Figure 7. Substrate choice control assays.
A. Wt neurons grown for 24 h on alternating lanes of the indicated synthetic substrates. The stripe deposited first was quenched with fluorescent BSA (green; superimposed TIRF and phase contrast images). White arrowheads point at neurite crossings from one substrate to the other. The neurites grew without substrate preference. Scale 20 µm. B. Cartoon to explain the border zone analysis. m1 and m2, matrix 1 and 2. The red arrow marks the border between them. Two bands, 5 µm wide, define the proximal (pbz) and juxtaposed (jbz) border zones. Arrowheads indicate measured axonal segments. C. Percent growth in juxtaposed stripe (border zone analysis). The frame of the bar graph identifies the substrate pairings, with “stripe1” and “stripe 2” deposited first and second, respectively. The cartoons of the neurons designate the position of their perikarya and growth directions. The bar (mean ± s.e.) in the same color as the neuron indicates % growth in the juxtaposed stripe. Letters a to f refer to the numerical data and statistics in Tables 6 and 7.
Figure 8
Figure 8. Substrate choice assays of wt versus mutant GCs.
Neurons were grown for 24 h on different matrix pairings. The stripe deposited first is green fluorescent. A. Superimposed phase contrast and TIRF images of wt (left column) and mutant neurons (center and right columns). Scale 20 µm. White arrowheads mark neurite crossings from one matrix to another. Axonal GCs with a substrate preference, i.e., avoiding the juxtaposed matrix (black arrowheads), are shown in the right column, together with fluorescence images of phalloidin label (red) of the same structures at higher magnification (bar 10 µm). Note the very large hAPP+ GC on Abp. B. Border zone analysis to indicate growth on juxtaposed matrix (percent cross-over) for wt and mutant neurons on different substrate pairings. The growth direction is shown by the neuron cartoon on the left, with the perikaryon on the matrices indicated below and the juxtaposed substrates listed on top. Most combinations (including all experiments with wt neurons) exhibit no growth preference. C. Average difference from control group and associated 95% confidence interval for the three significantly different combinations of neuron type*substrate pairings/growth directions. Negative values indicate preference for the substrate of origin.
Figure 9
Figure 9. Schematic of GC-substrate interactions mediated by the three cell adhesion molecules of interest in this study.
Itgb1 s and APP bind to distinct sequences on two different laminin subunits. Even though they can form complexes cell adhesion occurs independently, probably requiring distinct sets of cytoskeletal linker proteins.

References

    1. Roberson ED, Mucke L (2006) 100 years and counting: prospects for defeating Alzheimer's disease. Science 314: 781–784. - PMC - PubMed
    1. De Strooper B, Annaert W (2000) Proteolytic processing and cell biological functions of the amyloid precursor protein. J Cell Sci 113 (Pt 11): 1857–1870. - PubMed
    1. O'Brien RJ, Wong PC (2011) Amyloid precursor protein processing and Alzheimer's disease. Annu Rev Neurosci 34: 185–204. - PMC - PubMed
    1. Small DH, Nurcombe V, Reed G, Clarris H, Moir R, et al. (1994) A heparin-binding domain in the amyloid protein precursor of Alzheimer's disease is involved in the regulation of neurite outgrowth. J Neurosci 14: 2117–2127. - PMC - PubMed
    1. Beher D, Hesse L, Masters CL, Multhaup G (1996) Regulation of amyloid protein precursor (APP) binding to collagen and mapping of the binding sites on APP and collagen type I. J Biol Chem. 271: 1613–1620. - PubMed

Publication types

LinkOut - more resources