

Cross-species protein interactome mapping reveals species-specific wiring of stress response pathways
- PMID: 23695164
- PMCID: PMC3777727
- DOI: 10.1126/scisignal.2003350
Cross-species protein interactome mapping reveals species-specific wiring of stress response pathways
Abstract
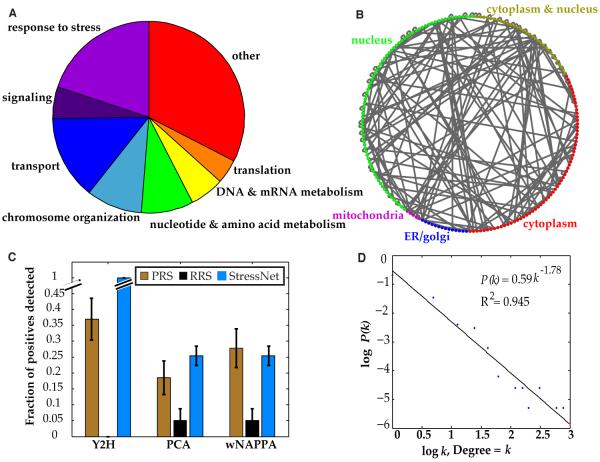
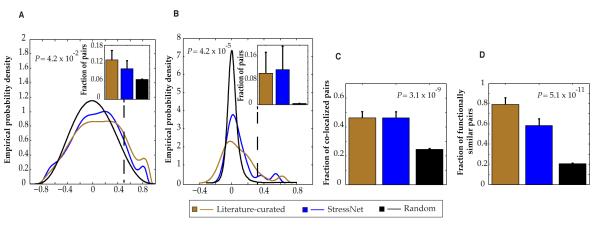
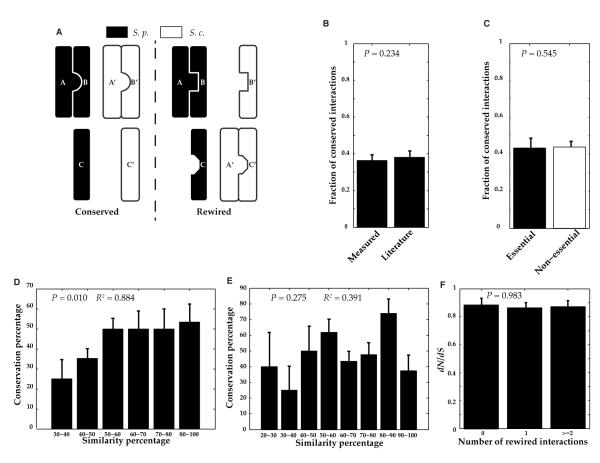
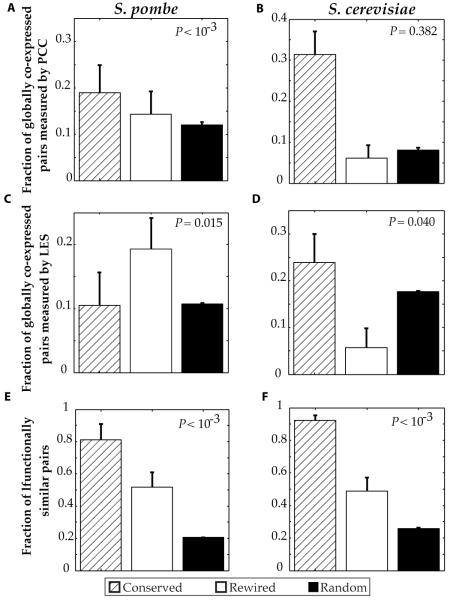
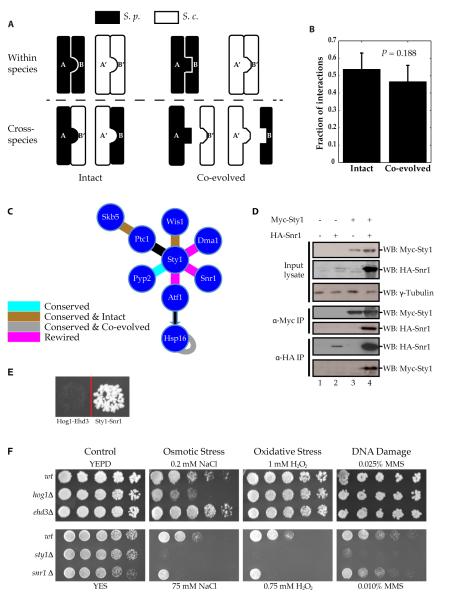
The fission yeast Schizosaccharomyces pombe has more metazoan-like features than the budding yeast Saccharomyces cerevisiae, yet it has similarly facile genetics. We present a large-scale verified binary protein-protein interactome network, "StressNet," based on high-throughput yeast two-hybrid screens of interacting proteins classified as part of stress response and signal transduction pathways in S. pombe. We performed systematic, cross-species interactome mapping using StressNet and a protein interactome network of orthologous proteins in S. cerevisiae. With cross-species comparative network studies, we detected a previously unidentified component (Snr1) of the S. pombe mitogen-activated protein kinase Sty1 pathway. Coimmunoprecipitation experiments showed that Snr1 interacted with Sty1 and that deletion of snr1 increased the sensitivity of S. pombe cells to stress. Comparison of StressNet with the interactome network of orthologous proteins in S. cerevisiae showed that most of the interactions among these stress response and signaling proteins are not conserved between species but are "rewired"; orthologous proteins have different binding partners in both species. In particular, transient interactions connecting proteins in different functional modules were more likely to be rewired than conserved. By directly testing interactions between proteins in one yeast species and their corresponding binding partners in the other yeast species with yeast two-hybrid assays, we found that about half of the interactions that are traditionally considered "conserved" form modified interaction interfaces that may potentially accommodate novel functions.
Figures
Similar articles
-
A Proteome-wide Fission Yeast Interactome Reveals Network Evolution Principles from Yeasts to Human.Cell. 2016 Jan 14;164(1-2):310-323. doi: 10.1016/j.cell.2015.11.037. Cell. 2016. PMID: 26771498 Free PMC article.
-
Comparative evolutionary analysis of cell cycle proteins networks in fission and budding yeast.Cell Biochem Biophys. 2014 Nov;70(2):1167-75. doi: 10.1007/s12013-014-0037-y. Cell Biochem Biophys. 2014. PMID: 24906232
-
Genetic approaches to aging in budding and fission yeasts: new connections and new opportunities.Subcell Biochem. 2012;57:291-314. doi: 10.1007/978-94-007-2561-4_13. Subcell Biochem. 2012. PMID: 22094427 Review.
-
Global proteome turnover analyses of the Yeasts S. cerevisiae and S. pombe.Cell Rep. 2014 Dec 11;9(5):1959-1965. doi: 10.1016/j.celrep.2014.10.065. Epub 2014 Nov 26. Cell Rep. 2014. PMID: 25466257 Free PMC article.
-
Vesicle-mediated protein transport pathways to the vacuole in Schizosaccharomyces pombe.Cell Struct Funct. 2003 Oct;28(5):399-417. doi: 10.1247/csf.28.399. Cell Struct Funct. 2003. PMID: 14745133 Review.
Cited by
-
Resurrected Protein Interaction Networks Reveal the Innovation Potential of Ancient Whole-Genome Duplication.Plant Cell. 2018 Nov;30(11):2741-2760. doi: 10.1105/tpc.18.00409. Epub 2018 Oct 17. Plant Cell. 2018. PMID: 30333148 Free PMC article.
-
A Proteome-wide Fission Yeast Interactome Reveals Network Evolution Principles from Yeasts to Human.Cell. 2016 Jan 14;164(1-2):310-323. doi: 10.1016/j.cell.2015.11.037. Cell. 2016. PMID: 26771498 Free PMC article.
-
Are transient protein-protein interactions more dispensable?PLoS Comput Biol. 2022 Apr 11;18(4):e1010013. doi: 10.1371/journal.pcbi.1010013. eCollection 2022 Apr. PLoS Comput Biol. 2022. PMID: 35404956 Free PMC article.
-
A massively parallel barcoded sequencing pipeline enables generation of the first ORFeome and interactome map for rice.Proc Natl Acad Sci U S A. 2020 May 26;117(21):11836-11842. doi: 10.1073/pnas.1918068117. Epub 2020 May 12. Proc Natl Acad Sci U S A. 2020. PMID: 32398372 Free PMC article.
-
Mutation Edgotype Drives Fitness Effect in Human.Front Bioinform. 2021 Aug 30;1:690769. doi: 10.3389/fbinf.2021.690769. eCollection 2021. Front Bioinform. 2021. PMID: 36303776 Free PMC article.
References
-
- Yu H, Braun P, Yildirim MA, Lemmens I, Venkatesan K, Sahalie J, Hirozane-Kishikawa T, Gebreab F, Li N, Simonis N, Hao T, Rual JF, Dricot A, Vazquez A, Murray RR, Simon C, Tardivo L, Tam S, Svrzikapa N, Fan C, de Smet AS, Motyl A, Hudson ME, Park J, Xin X, Cusick ME, Moore T, Boone C, Snyder M, Roth FP, Barabasi AL, Tavernier J, Hill DE, Vidal M. High-quality binary protein interaction map of the yeast interactome network. Science. 2008;322:104. - PMC - PubMed
-
- Uetz P, Giot L, Cagney G, Mansfield TA, Judson RS, Knight JR, Lockshon D, Narayan V, Srinivasan M, Pochart P, Qureshi-Emili A, Li Y, Godwin B, Conover D, Kalbfleisch T, Vijayadamodar G, Yang M, Johnston M, Fields S, Rothberg JM. A comprehensive analysis of protein-protein interactions in Saccharomyces cerevisiae. Nature. 2000;403:623. - PubMed
-
- Formstecher E, Aresta S, Collura V, Hamburger A, Meil A, Trehin A, Reverdy C, Betin V, Maire S, Brun C, Jacq B, Arpin M, Bellaiche Y, Bellusci S, Benaroch P, Bornens M, Chanet R, Chavrier P, Delattre O, Doye V, Fehon R, Faye G, Galli T, Girault JA, Goud B, de Gunzburg J, Johannes L, Junier MP, Mirouse V, Mukherjee A, Papadopoulo D, Perez F, Plessis A, Rosse C, Saule S, Stoppa-Lyonnet D, Vincent A, White M, Legrain P, Wojcik J, Camonis J, Daviet L. Protein interaction mapping: a Drosophila case study. Genome Res. 2005;15:376. - PMC - PubMed
-
- Giot L, Bader JS, Brouwer C, Chaudhuri A, Kuang B, Li Y, Hao YL, Ooi CE, Godwin B, Vitols E, Vijayadamodar G, Pochart P, Machineni H, Welsh M, Kong Y, Zerhusen B, Malcolm R, Varrone Z, Collis A, Minto M, Burgess S, McDaniel L, Stimpson E, Spriggs F, Williams J, Neurath K, Ioime N, Agee M, Voss E, Furtak K, Renzulli R, Aanensen N, Carrolla S, Bickelhaupt E, Lazovatsky Y, DaSilva A, Zhong J, Stanyon CA, Finley RL, Jr., White KP, Braverman M, Jarvie T, Gold S, Leach M, Knight J, Shimkets RA, McKenna MP, Chant J, Rothberg JM. A protein interaction map of Drosophila melanogaster. Science. 2003;302:1727. - PubMed
Publication types
MeSH terms
Substances
Grants and funding
LinkOut - more resources
Full Text Sources
Other Literature Sources
Molecular Biology Databases
