. 2014 Jan;22(1):144-7.
doi: 10.1038/ejhg.2013.96. Epub 2013 May 22.

Phenotype-Genotype Integrator (PheGenI): synthesizing genome-wide association study (GWAS) data with existing genomic resources

Affiliations

Phenotype-Genotype Integrator (PheGenI): synthesizing genome-wide association study (GWAS) data with existing genomic resources

Erin M Ramos et al. Eur J Hum Genet. 2014 Jan.

Abstract

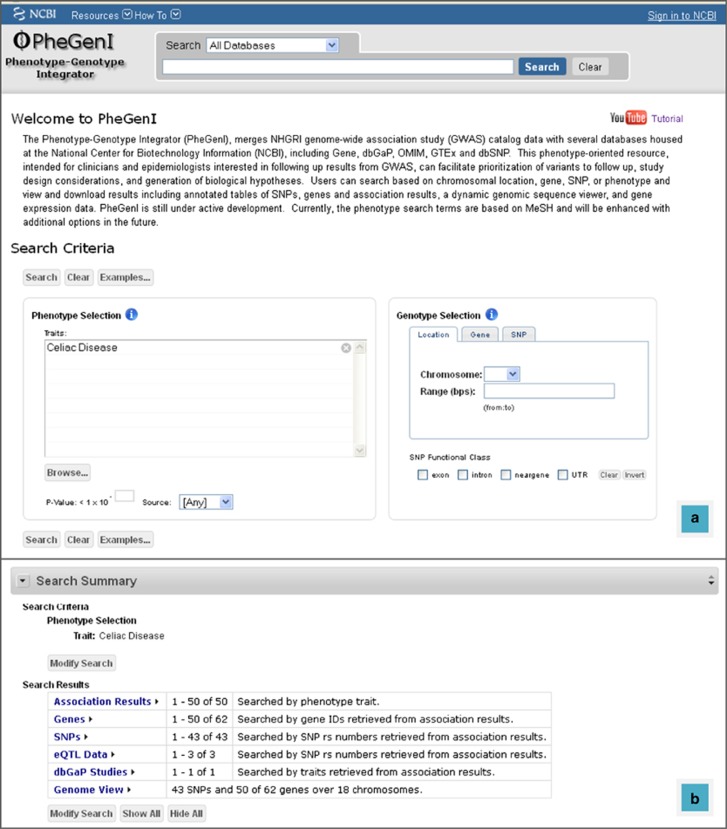
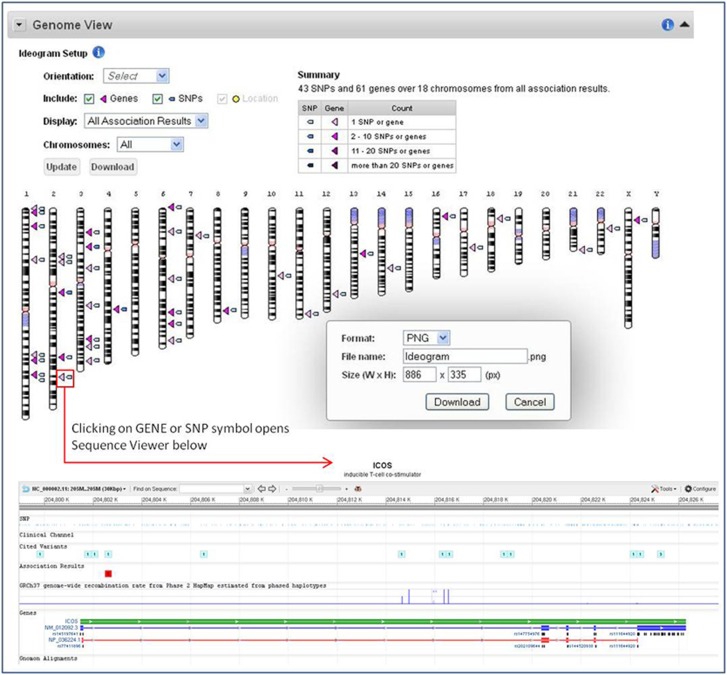
Rapidly accumulating data from genome-wide association studies (GWASs) and other large-scale studies are most useful when synthesized with existing databases. To address this opportunity, we developed the Phenotype-Genotype Integrator (PheGenI), a user-friendly web interface that integrates various National Center for Biotechnology Information (NCBI) genomic databases with association data from the National Human Genome Research Institute GWAS Catalog and supports downloads of search results. Here, we describe the rationale for and development of this resource. Integrating over 66,000 association records with extensive single nucleotide polymorphism (SNP), gene, and expression quantitative trait loci data already available from the NCBI, PheGenI enables deeper investigation and interrogation of SNPs associated with a wide range of traits, facilitating the examination of the relationships between genetic variation and human diseases.


Figures

Figure 1
Figure 1
PheGenI search interface and results summary. (a) The PheGenI search interface. In this example, a search was performed for the celiac disease trait. (b) The summary table of results returned for the celiac disease query.
Figure 2
Figure 2
PheGenI genome view and sequence viewer. PheGenI association results displayed on a customizable and downloadable ideogram. In this example, 43 SNPs (blue triangles) and 61 genes (pink triangles) across 18 chromosomes were identified as associated with celiac disease (P-value threshold set at 1 × 10⁻⁸). Clicking on the SNP or GENE triangle opens up a customizable sequence viewer to further explore a particular genomic region.
Figure 3
Figure 3
Distribution of PheGenI SNPs with association data across broad phenotype categories. The majority of SNP–trait associations can be assigned to a few broad MeSH categories.

References

    1. Hindorff LA, Sethupathy P, Junkins HA, et al. Potential etiologic and functional implications of genome-wide association loci for human diseases and traits. Proc Natl Acad Sci USA. 2009;106:9362–9367. - PMC - PubMed
    1. Mailman MD, Feolo M, Jin Y, et al. The NCBI dbGap database of genotypes and phenotypes. Nat Genet. 2007;2007;39:1181–1186. - PMC - PubMed
    1. Savage A. Changes in MeSH data Structure. NLM Tech Bull. 2000;313:e2.
    1. Johnson AD, O'Donnell CJ. An open access database of genome-wide association results. BMC Med Genet. 2009;10:6. - PMC - PubMed
    1. Schully SD, Yu W, McCallum V, et al. Cancer GAMAdb: database of cancer genetic associations from meta-analyses and genome-wide association studies. Eur J Hum Genet. 2011;19:928–930. - PMC - PubMed

Publication types