. 2013 Jul;162(3):1290-310.
doi: 10.1104/pp.113.217380. Epub 2013 May 21.

Comprehensive dissection of spatiotemporal metabolic shifts in primary, secondary, and lipid metabolism during developmental senescence in Arabidopsis

Affiliations

Comprehensive dissection of spatiotemporal metabolic shifts in primary, secondary, and lipid metabolism during developmental senescence in Arabidopsis

Mutsumi Watanabe et al. Plant Physiol. 2013 Jul.

Abstract

Developmental senescence is a coordinated physiological process in plants and is critical for nutrient redistribution from senescing leaves to newly formed sink organs, including young leaves and developing seeds. Progress has been made concerning the genes involved and the regulatory networks controlling senescence. The resulting complex metabolome changes during senescence have not been investigated in detail yet. Therefore, we conducted a comprehensive profiling of metabolites, including pigments, lipids, sugars, amino acids, organic acids, nutrient ions, and secondary metabolites, and determined approximately 260 metabolites at distinct stages in leaves and siliques during senescence in Arabidopsis (Arabidopsis thaliana). This provided an extensive catalog of metabolites and their spatiotemporal cobehavior with progressing senescence. Comparison with silique data provides clues to source-sink relations. Furthermore, we analyzed the metabolite distribution within single leaves along the basipetal sink-source transition trajectory during senescence. Ceramides, lysolipids, aromatic amino acids, branched chain amino acids, and stress-induced amino acids accumulated, and an imbalance of asparagine/aspartate, glutamate/glutamine, and nutrient ions in the tip region of leaves was detected. Furthermore, the spatiotemporal distribution of tricarboxylic acid cycle intermediates was already changed in the presenescent leaves, and glucosinolates, raffinose, and galactinol accumulated in the base region of leaves with preceding senescence. These results are discussed in the context of current models of the metabolic shifts occurring during developmental and environmentally induced senescence. As senescence processes are correlated to crop yield, the metabolome data and the approach provided here can serve as a blueprint for the analysis of traits and conditions linking crop yield and senescence.


Figures
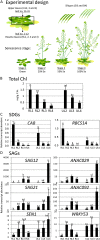
Figure 1.
Figure 1.
Developmental leaf senescence in Arabidopsis. A, Senescence stages of Arabidopsis plants during the experiment. Rosette leaves (leaf nos. 1–12) at four developmental stages (stages 1–4), upper leaves (leaf nos. 13–41) at three stages (stages 2–4), and siliques containing developing seeds at two stages (stages 3 and 4) were harvested. B, Chlorophyll changes though leaf senescence. Data represent mean values of five biological replicates for each time point. F.W., Fresh weight. C and D, Transcript abundance of SDGs and SAGs. Expression levels of SDGs (C), CAB and RBCS1A, and SAGs (D), SAG12, SAG21, SEN1, ANAC029, ANAC092, and WRKY53, were measured by qRT-PCR. Transcript abundance of the genes in rosette leaves and upper leaves is presented as mean fold changes from RL1. Expression values were normalized to relative levels of PDF2. Data represent mean values of two biological replicates for each time point, each measured in two technical replicates. Error bars in B to D represent sd. Different letters represent statistically significant differences (P < 0.05) using Tukey’s test.
Figure 2.
Figure 2.
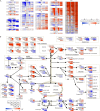
Heat map of metabolite changes through plant senescence. Lipids, pigments, and quinones (A) and primary and secondary metabolites (B) are displayed on a metabolic pathway representation. Log2 ratios of fold changes from RL1 are given by shades of red or blue colors according to the scale bar. Data represent mean values of three to five biological replicates for each tissue and time point. Statistical analysis was performed using Tukey’s test (Supplemental Table S3). Abbreviations not already defined are as follows: Cer, ceramide; Chl, chlorophyll; DAG, diacylglycerol; GlcCer, glucosylceramide; flavonols [K-3RG-7R, K-3G-7R, K-3R-7R, and Q-3RG-7R, for kaempferol 3-O-rhamnosyl(1→2)glucoside-7-O-rhamnoside, kaempferol 3-O-glucoside-7-O-rhamnoside, kaempferol 3-O-rhamnoside-7-O-rhamnoside, and quercetin 3-O-rhamnosyl-(1→2)glucoside-7-O-rhamnoside, respectively]; Met-GLSs (5MSOP, 6MSOH, 7MSOH, and 8MSOO, for 5-methylsulfinylpentyl-GLS, 6-methylsulfinylhexyl-GLS, 7-methylsulfinylheptyl-GLS, and 8-methylsulfinyloctyl-GLS, respectively); PC, phosphatidylcholine; PE, phosphatidylethanolamine; Sin-Glc, sinapoyl-Glc; Sin-Mal, sinapoyl-malate; SQDG, sulfoquinovosyldiacylglycerol.
Figure 3.
Figure 3.
Heat map of metabolite changes during leaf expansion and early senescence. A, Schematic representation of samples used for metabolite profiling. Plants were gown under short-day conditions. A single leaf (13th or 14th leaf emerging after germination) was harvested at three developmental stages. Upon harvesting, the leaf was divided into three parts of equivalent lengths termed tip (T), middle (M), and base (B). B, SAG12 expression level. Transcript abundance of the gene is presented as mean fold changes from B1. Expression values were normalized to relative levels of PDF2. Data represent mean values of two biological replicates for each time point, each measured in two technical replicates. Error bars represent sd. Different letters represent statistically significant differences (P < 0.05) using Tukey’s test. F.W., Fresh weight. C and D, Lipids, pigments, and quinones (C) and primary and secondary metabolites (D) displayed on a metabolic pathway representation. Log2 ratios of fold changes from the average at the first stage (the average value of T1, M1, and B1) are given by shades of red or blue colors according to the scale bar. Data represent mean values of three to five biological replicates for each time point. Statistical analysis was performed using Tukey’s test (Supplemental Table S4). ND, Not determined. For abbreviations of metabolite names, see Figure 2.
Figure 4.
Figure 4.
Heat map of metabolite distributions within single leaves. A, Lipids, pigments, and quinones. B, Primary and secondary metabolites. Log2 ratios of fold changes at each stage from the average values of all parts at each stage are shown. Statistical analysis was performed using Tukey’s test (Supplemental Table S4). N.D., Not determined. For abbreviations of metabolite names, see Figure 2.
Figure 5.
Figure 5.
Changes of the selected metabolites in the tip (T), middle (M), and base (B) regions of single leaves during expansion and early senescence. A, Sugars. B, Galactinol and raffinose. C, BCAAs. D, AAAs. E, Stress response amino acids (AAs). F, Met-GLS. G, Indole-GLSs. H, TCA cycle metabolites. I, Nutrient ions. J, Gln, Glu, Asn, and Asp. Peak height for A, B, E, and H in GC-TOF-MS analyses and peak area for F and G in LC-electrospray ionization-MS analyses were normalized to sample fresh weight. The unit for C, D, and J in HPLC analyses is nmol g−1 fresh weight (FW). The unit for I in ion analysis is μmol g−1 fresh weight. Data represent mean values of three to five bulked samples for each leaf region at each time point. Error bars represent sd. Different letters represent statistically significant differences (P < 0.05) using Tukey’s test (Supplemental Table S4). For abbreviations of metabolite names, see Figure 2.
Figure 6.
Figure 6.
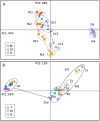
PCA score plot of metabolite profiles. The plots were applied for the approximately 260 annotated metabolites, including primary and secondary metabolites and lipids, which were detected in whole-plant (A) and single-leaf (B) experiments. PCA was conducted by the MultiExperiment Viewer (Saeed et al., 2003). PC, Principal component. In A, circles, triangles, and squares indicate biological replicates of rosette leaves (RL), upper leaves (UL), and siliques (SI), respectively. In B, circles, triangles, and squares indicate biological replicates of base (B), tip (T), and middle (M) leaf segments, respectively.

References

    1. Agati G, Tattini M. (2010) Multiple functional roles of flavonoids in photoprotection. New Phytol 186: 786–793 - PubMed
    1. Alleva R, Tomasetti M, Andera L, Gellert N, Borghi B, Weber C, Murphy MP, Neuzil J. (2001) Coenzyme Q blocks biochemical but not receptor-mediated apoptosis by increasing mitochondrial antioxidant protection. FEBS Lett 503: 46–50 - PubMed
    1. Anderson ME. (1985) Determination of glutathione and glutathione disulfide in biological samples. Methods Enzymol 113: 548–555 - PubMed
    1. Araújo WL, Ishizaki K, Nunes-Nesi A, Larson TR, Tohge T, Krahnert I, Witt S, Obata T, Schauer N, Graham IA, et al (2010) Identification of the 2-hydroxyglutarate and isovaleryl-CoA dehydrogenases as alternative electron donors linking lysine catabolism to the electron transport chain of Arabidopsis mitochondria. Plant Cell 22: 1549–1563 - PMC - PubMed
    1. Araújo WL, Tohge T, Ishizaki K, Leaver CJ, Fernie AR. (2011) Protein degradation: an alternative respiratory substrate for stressed plants. Trends Plant Sci 16: 489–498 - PubMed

Publication types

LinkOut - more resources