

Constitutive somatostatin receptor subtype 2 activity attenuates GH synthesis
- PMID: 23696564
- PMCID: PMC3689284
- DOI: 10.1210/en.2013-1132
Constitutive somatostatin receptor subtype 2 activity attenuates GH synthesis
Abstract
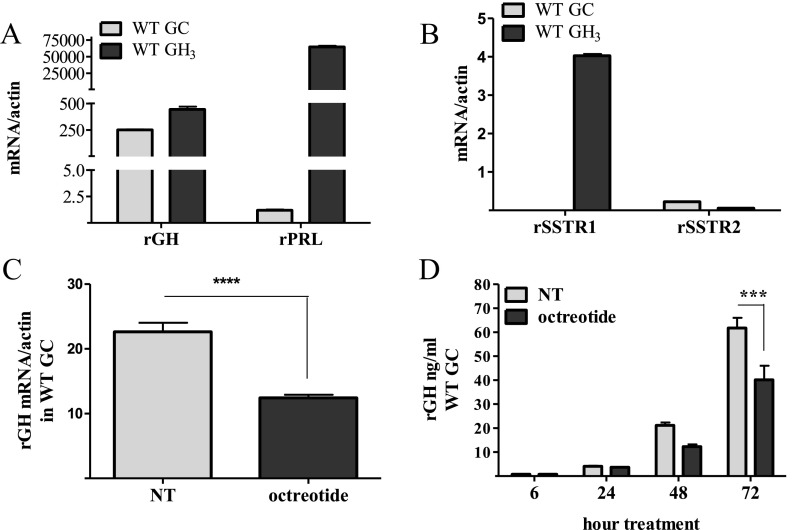
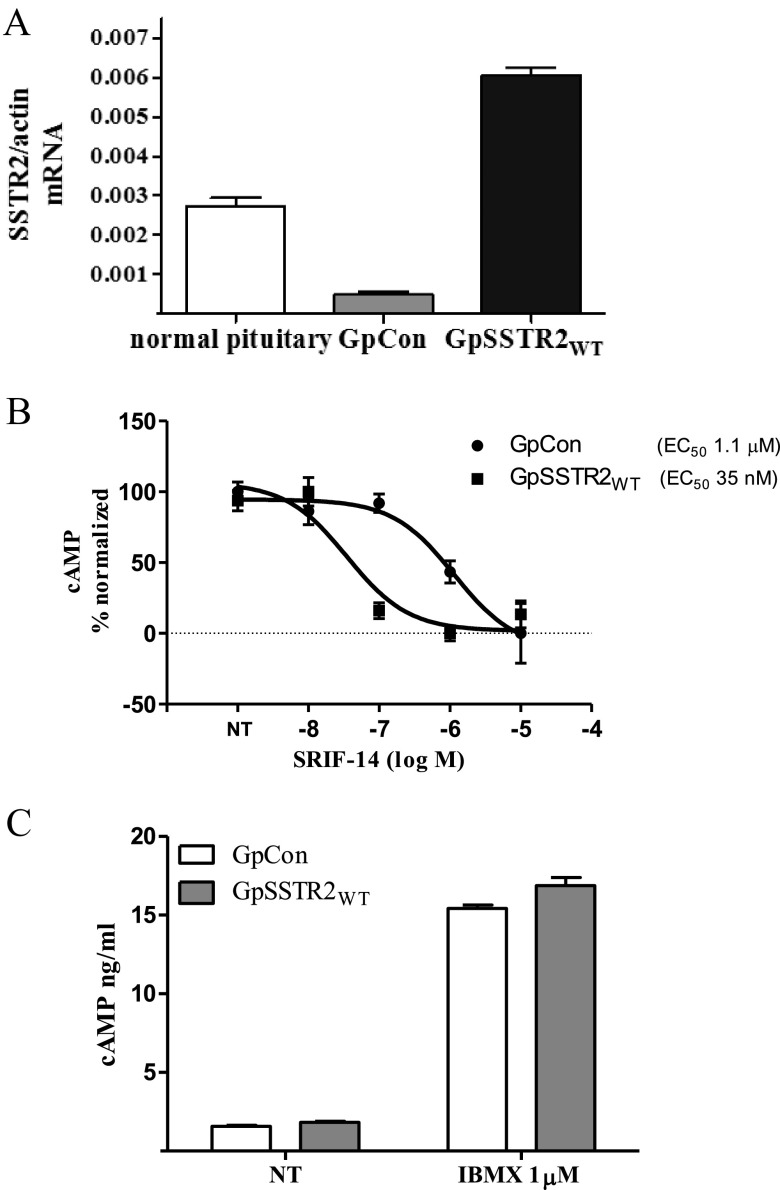
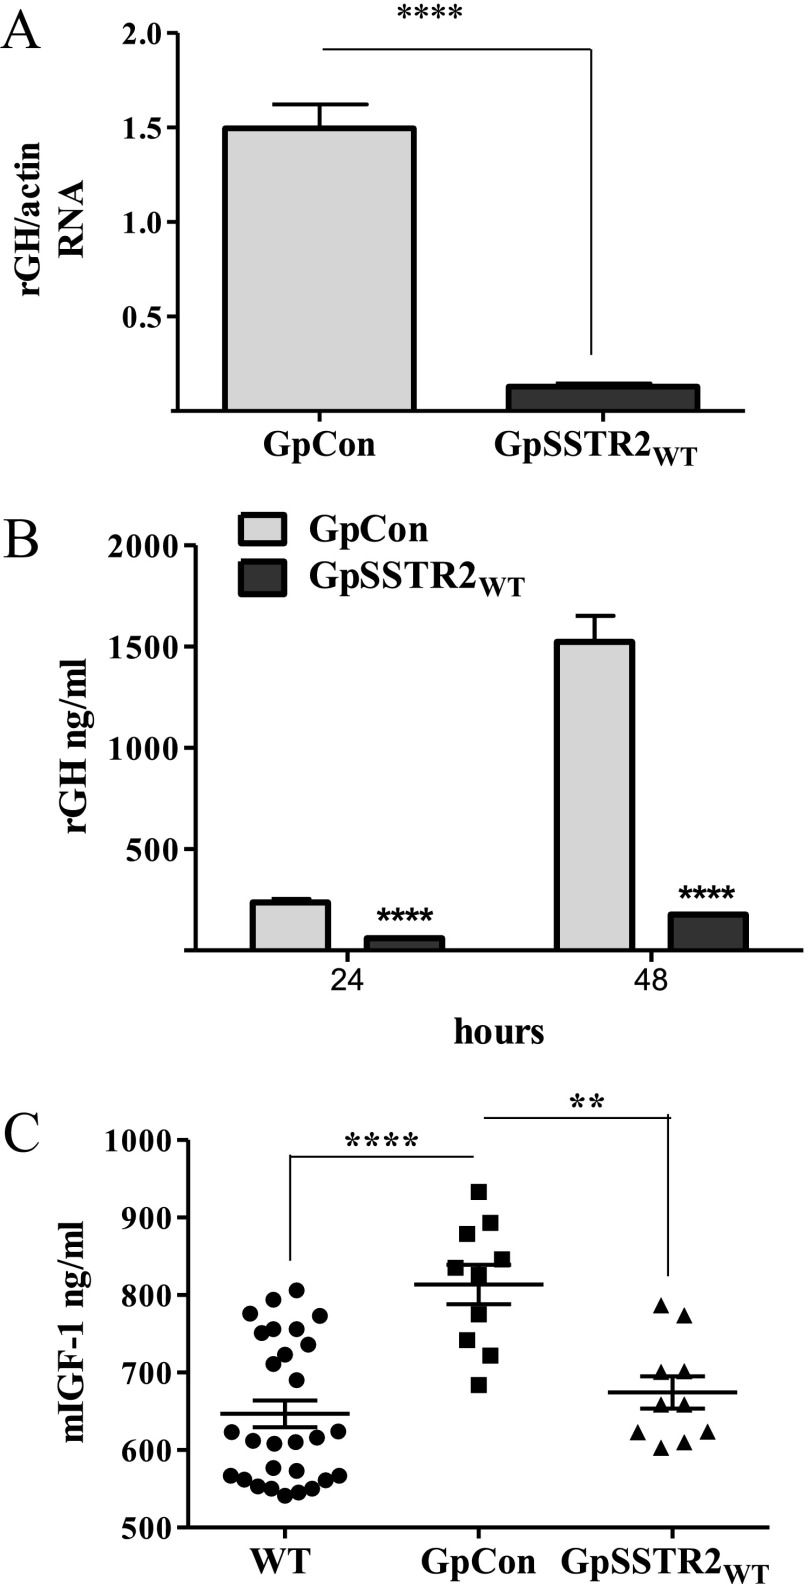
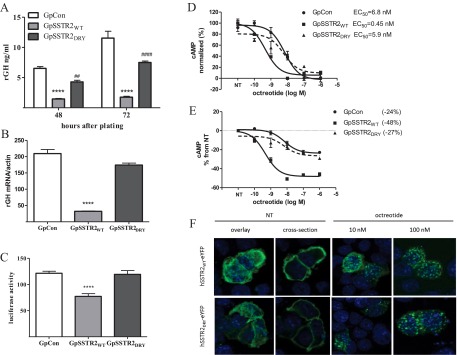
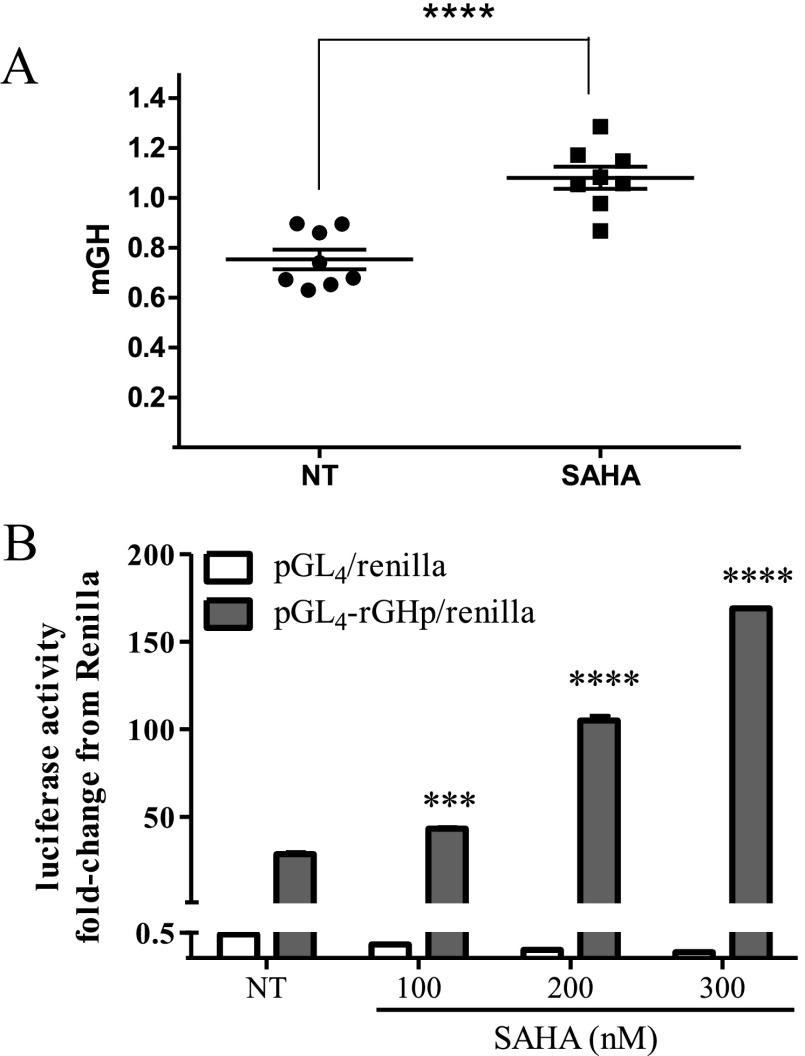
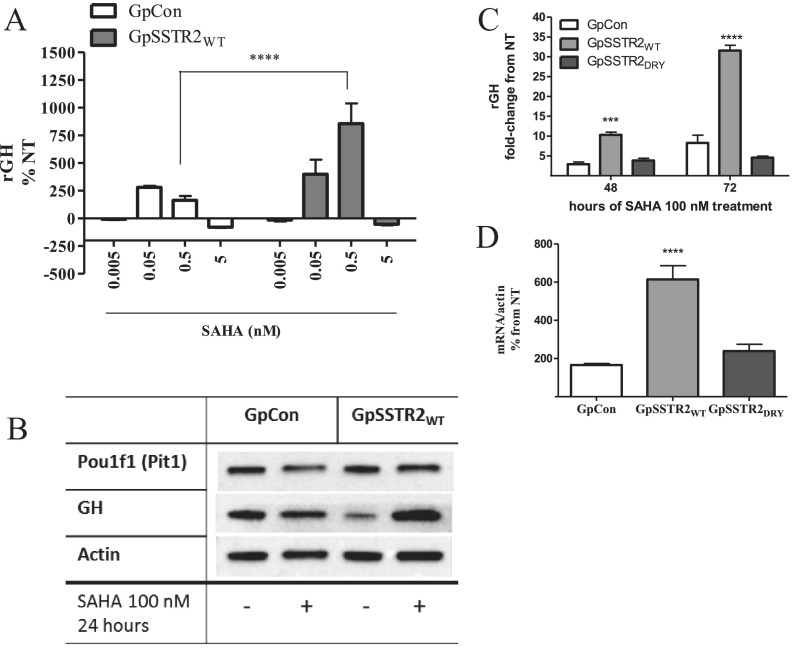
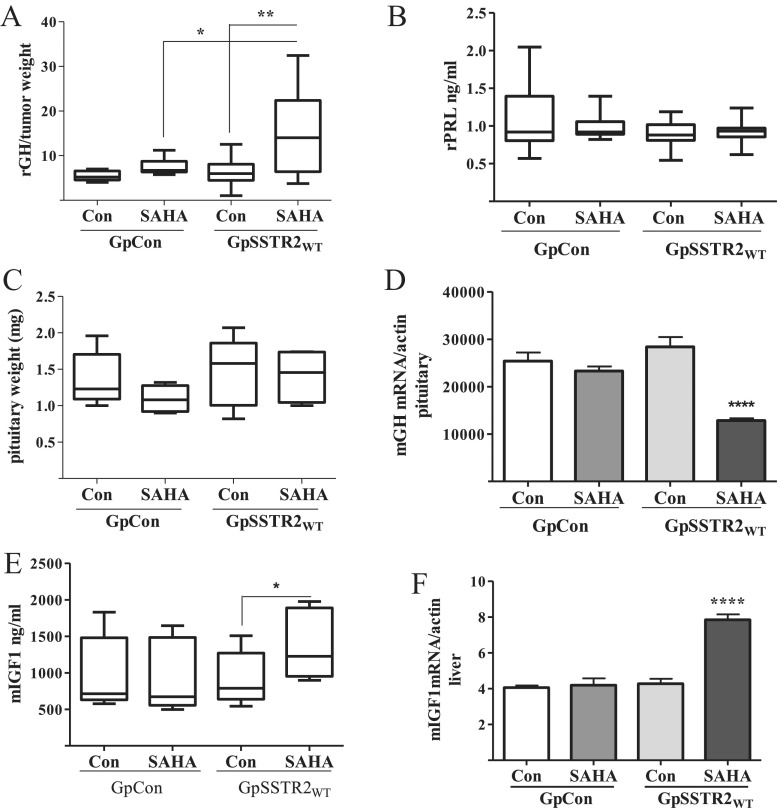
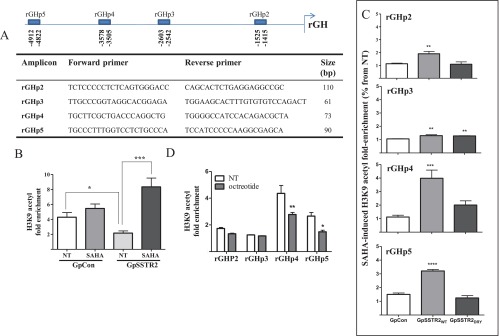
Somatostatin signals predominantly through somatostatin receptor (SSTR) subtype 2 to attenuate GH release. However, the independent role of the receptor in regulating GH synthesis is unclear. Because we had previously demonstrated constitutive SSTR2 activity in mouse corticotrophs, we now analyzed GH regulation in rat pituitary somatotroph (GC) tumor cells, which express SSTR2 exclusively and are devoid of endogenous somatostatin ligand. We demonstrate that moderately stable SSTR2 overexpression (GpSSTR2(WT) cells) was associated with decreased GH promoter activity, GH mRNA, and hormone levels compared with those of control transfectants (GpCon cells). In contrast, levels of GH mRNA and peptide and GH promoter activity were unchanged in GpSSTR2(DRY) stable transfectants moderately expressing DRY motif mutated SSTR2 (R140A). GpSSTR(2DRY) did not exhibit an enhanced octreotide response as did GpSSTR2(WT) cells; however, both SSTR2(WT)-enhanced yellow fluorescent protein (eYFP) and SSTR2(DRY)-eYFP internalized on octreotide treatment. Suberoylanilide hydroxamic acid (SAHA), a histone deacetylase inhibitor, increased GH synthesis in wild-type GC cells and primary pituitary cultures. GpSSTR2(WT) cells induced GH synthesis more strongly on SAHA treatment, evident by both higher GH peptide and mRNA levels compared with the moderate but similar GH increase observed in GpCon and GpSSTR2(DRY) cells. In vivo SAHA also increased GH release from GpSSTR2(WT) but not from control xenografts. Endogenous rat GH promoter chromatin immunoprecipitation showed decreased baseline acetylation of the GH promoter with exacerbated acetylation after SAHA treatment in GpSSTR2(WT) compared with that of either GpSSTR(2DRY) or control cells, the latter 2 transfectants exhibiting similar GH promoter acetylation levels. In conclusion, modestly increased SSTR2 expression constitutively decreases GH synthesis, an effect partially mediated by GH promoter histone deacetylation.
Figures
Similar articles
-
Constitutive somatostatin receptor subtype-3 signaling suppresses growth hormone synthesis.Mol Endocrinol. 2014 Apr;28(4):554-64. doi: 10.1210/me.2013-1327. Epub 2014 Feb 25. Mol Endocrinol. 2014. PMID: 24606125 Free PMC article.
-
Somatostatin receptor (SSTR) subtype-selective analogues differentially suppress in vitro growth hormone and prolactin in human pituitary adenomas. Novel potential therapy for functional pituitary tumors.J Clin Invest. 1997 Nov 1;100(9):2386-92. doi: 10.1172/JCI119779. J Clin Invest. 1997. PMID: 9410919 Free PMC article.
-
Somatostatin receptor subtype specificity in human fetal pituitary cultures. Differential role of SSTR2 and SSTR5 for growth hormone, thyroid-stimulating hormone, and prolactin regulation.J Clin Invest. 1997 Feb 15;99(4):789-98. doi: 10.1172/JCI119225. J Clin Invest. 1997. PMID: 9045884 Free PMC article.
-
Somatostatin receptors in pituitary and development of somatostatin receptor subtype-selective analogs.Endocrine. 2003 Apr;20(3):265-9. doi: 10.1385/ENDO:20:3:265. Endocrine. 2003. PMID: 12721506 Review.
-
Somatostatin receptor ligands and resistance to treatment in pituitary adenomas.J Mol Endocrinol. 2014 Jun;52(3):R223-40. doi: 10.1530/JME-14-0011. Epub 2014 Mar 19. J Mol Endocrinol. 2014. PMID: 24647046 Review.
Cited by
-
Thyrotropin-Releasing Hormone (TRH) and Somatostatin (SST), but not Growth Hormone-Releasing Hormone (GHRH) nor Ghrelin (GHRL), Regulate Expression and Release of Immune Growth Hormone (GH) from Chicken Bursal B-Lymphocyte Cultures.Int J Mol Sci. 2020 Feb 20;21(4):1436. doi: 10.3390/ijms21041436. Int J Mol Sci. 2020. PMID: 32093298 Free PMC article.
-
Influence of Leptin on the Secretion of Growth Hormone in Ewes under Different Photoperiodic Conditions.Int J Mol Sci. 2023 Apr 28;24(9):8036. doi: 10.3390/ijms24098036. Int J Mol Sci. 2023. PMID: 37175738 Free PMC article.
-
Extended Photoperiod Facilitated the Restoration of the Expression of GH-IGF Axis Genes in Submerged Rainbow Trout (Oncorhynchus mykiss).Int J Mol Sci. 2024 Dec 19;25(24):13583. doi: 10.3390/ijms252413583. Int J Mol Sci. 2024. PMID: 39769354 Free PMC article.
-
Leptin Modulates the Response of Brown Adipose Tissue to Negative Energy Balance: Implication of the GH/IGF-I Axis.Int J Mol Sci. 2021 Mar 11;22(6):2827. doi: 10.3390/ijms22062827. Int J Mol Sci. 2021. PMID: 33799501 Free PMC article.
-
Structural insights into the activation of somatostatin receptor 2 by cyclic SST analogues.Cell Discov. 2022 May 20;8(1):47. doi: 10.1038/s41421-022-00405-2. Cell Discov. 2022. PMID: 35595746 Free PMC article.
References
-
- Smit MJ, Vischer HF, Bakker RA, et al. Pharmacogenomic and structural analysis of constitutive G protein-coupled receptor activity. Annu Rev Pharmacol Toxicol. 2007;47:53–87 - PubMed
-
- Seifert R, Wenzel-Seifert K. Constitutive activity of G-protein-coupled receptors: cause of disease and common property of wild-type receptors. Naunyn Schmiedebergs Arch Pharmacol. 2002;366:381–416 - PubMed
-
- Conn PM, ed. Constitutive Activity in Receptors and Other Proteins, Part A. New York, NY: Academic Press; 2010. Methods in Enzymology, vol 484
-
- Ben-Shlomo A, Pichurin O, Barshop NJ, et al. Selective regulation of somatostatin receptor subtype signaling: evidence for constitutive receptor activation. Mol Endocrinol. 2007;21:2565–2578 - PubMed
Publication types
MeSH terms
Substances
Grants and funding
LinkOut - more resources
Full Text Sources
Other Literature Sources
Miscellaneous
