

Assessing the correlation between grey and white matter damage with motor and cognitive impairment in multiple sclerosis patients
- PMID: 23696802
- PMCID: PMC3655958
- DOI: 10.1371/journal.pone.0063250
Assessing the correlation between grey and white matter damage with motor and cognitive impairment in multiple sclerosis patients
Abstract
Background: Multiple sclerosis (MS) is characterized by demyelinating and degenerative processes within the central nervous system. Unlike conventional MRI,new advanced imaging techniques improve pathological specificity and better highlight the relationship between anatomical damage and clinical impairment.
Objective: To investigate the relationship between clinical disability and both grey (GM) and white matter (WM) regional damage in MS patients.
Methods: Thirty-six relapsing remitting-MS patients and 25 sex- and age-matched controls were enrolled. All patients were clinically evaluated by the Expanded Disability Status Scale and the Multiple Sclerosis Functional Composite (MSFC) scale, which includes the 9-hole peg test (9HPT), the timed 25-feet walking test (T25FW) and the paced auditory serial addition test (PASAT). All subjects were imaged by a 3.0 T scanner: dual-echo fast spin-echo, 3DT1-weighted and diffusion-tensor imaging (DTI) sequences were acquired. Voxel-based morphometry (VBM) and tract-based spatial statistics (TBSS) analyses were run for regional GM and WM assessment, respectively. T2 lesion volumes were also calculated, by using a semi-automated technique.
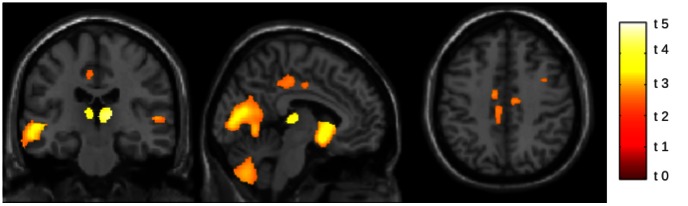
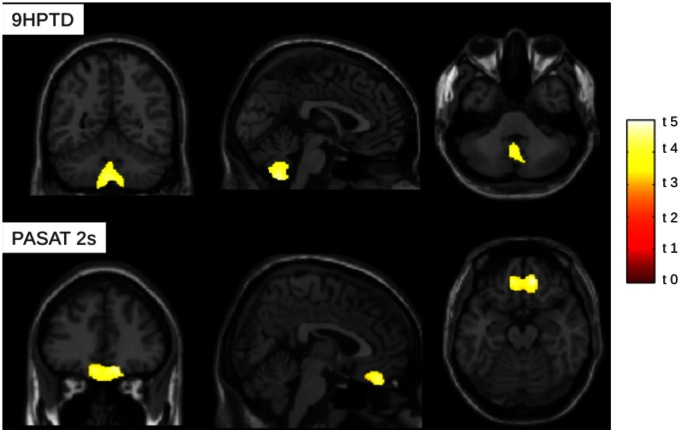
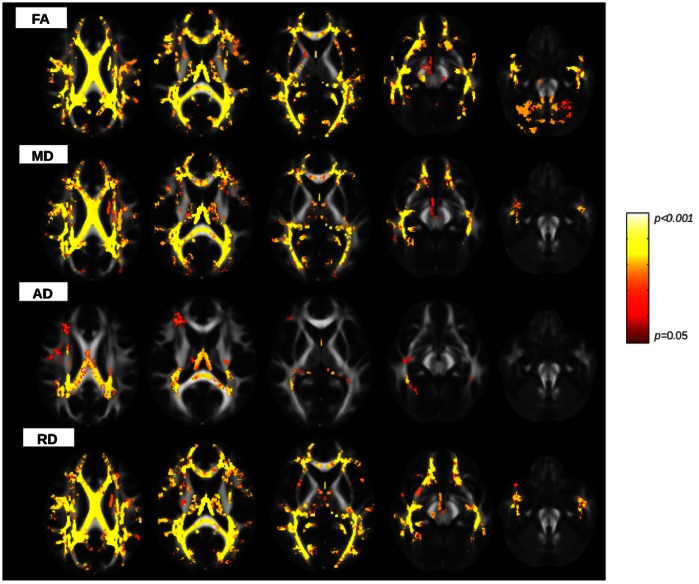
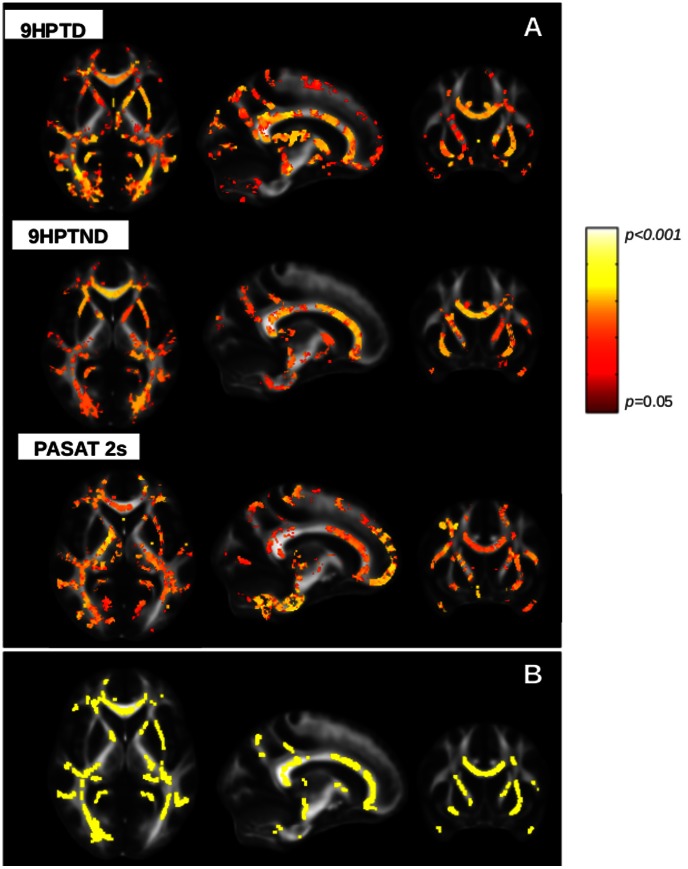
Results: Brain volumetric assessment of GM and DTI measures revealed significant differences between patients and controls. In patients, different measures of WM damage correlated each-other (p<0.0001), whereas none of them correlated with GM volume. In patients, focal GM atrophy and widespread WM damage significantly correlated with clinical measures. In particular, VBM analysis revealed a significant correlation (p<0.05) between GM volume and 9HPT in cerebellum and between GM volume and PASAT in orbito-frontal cortex. TBSS showed significant correlations between DTI metrics with 9HPT and PASAT scores in many WM bundles (p<0.05), including corpus callosum, internal capsule, posterior thalamic radiations, cerebral peduncles.
Conclusions: Selective GM atrophy and widespread WM tracts damage are associated with functional impairment of upper-limb motion and cognition. The combined analysis of volumetric and DTI data may help to better understand structural alterations underlying physical and cognitive dysfunction in MS.
Conflict of interest statement
Figures
References
-
- Evangelou N, Esiri MM, Smith S, Palace J, Matthews PM (2000) Quantitative pathological evidence for axonal loss in normal appearing white matter in multiple sclerosis. Ann Neurol 47: 391–395. - PubMed
-
- Bjartmar C, Kinkel RP, Kidd G, Rudick RA, Trapp BD (2001) Axonal loss in normal-appearing white matter in a patient with acute MS. Neurology 57: 1248–1252. - PubMed
-
- Kidd D, Barkhof F, McConnell R, Algra PR, Allen IV, et al. (1999) Cortical lesions in multiple sclerosis. Brain 122 (Pt 1): 17–26. - PubMed
-
- Tortorella P, Rocca MA, Mezzapesa DM, Ghezzi A, Lamantia L, et al. (2006) MRI quantification of gray and white matter damage in patients with early-onset multiple sclerosis. J Neurol 253: 903–907 doi:10.1007/s00415-006-0129-8. - DOI - PubMed
-
- Onu M, Roceanu A, Sboto-Frankenstein U, Bendic R, Tarta E, et al. (2012) Diffusion abnormality maps in demyelinating disease: correlations with clinical scores. Eur J Radiol 81: e386–391 doi:10.1016/j.ejrad.2011.12.014. - DOI - PubMed
Publication types
MeSH terms
LinkOut - more resources
Full Text Sources
Other Literature Sources
Medical
