. 2013 Jul;19(7):937-47.
doi: 10.1261/rna.038430.113. Epub 2013 May 22.

The roles of 3'-exoribonucleases and the exosome in trypanosome mRNA degradation

Affiliations

The roles of 3'-exoribonucleases and the exosome in trypanosome mRNA degradation

Abeer Fadda et al. RNA. 2013 Jul.

Abstract

The degradation of eukaryotic mRNAs can be initiated by deadenylation, decapping, or endonuclease cleavage. This is followed by 5'-3' degradation by homologs of Xrn1, and/or 3'-5' degradation by the exosome. We previously reported that, in African trypanosome Trypanosoma brucei, most mRNAs are deadenylated prior to degradation, and that depletion of the major 5'-3' exoribonuclease XRNA preferentially stabilizes unstable mRNAs. We now show that depletion of either CAF1 or CNOT10, two components of the principal deadenylation complex, strongly inhibits degradation of most mRNAs. RNAi targeting another deadenylase, PAN2, or RRP45, a core component of the exosome, preferentially stabilized mRNAs with intermediate half-lives. RRP45 depletion resulted in a 5' bias of mRNA sequences, suggesting action by a distributive 3'-5' exoribonuclease. Results suggested that the exosome is involved in the processing of trypanosome snoRNAs. There was no correlation between effects on half-lives and on mRNA abundance.

Keywords: CAF1; PAN2; Trypanosoma; deadenylation; exosome; mRNA decay; mRNA degradation.


Figures

FIGURE 1.
FIGURE 1.
Spliced leader hybridization to Northern blots of the RNA samples sent for sequencing. RNA from different cells was prepared and subjected to Northern blotting with a spliced leader RNA 39mer oligonucleotide probe. Three similar samples were tested for each line; one typical lane is shown. A second set of lanes from wild-type (WT) and CNOT10 RNAi was shown in Färber et al. (2013). The arrow points to the spliced leader precursor RNA, and the asterisk marks signal from the 7SL (signal recognition particle) RNA left from a previous hybridization. The mRNA signal was quantitated in the region from ∼400 nt to 6 kb. The panel below shows the methylene blue signal from rRNA on the corresponding blot segments. The hybridization signals for individual RNAi lines differ because RNA from each cell line was run on a different gel. For further comparisons see Supplemental Figure S1.
FIGURE 2.
FIGURE 2.
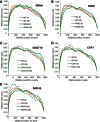
Depletion of RRP45 results in a 5′ read bias. Predominant polyadenylation and splice acceptor sites for as many mRNAs as possible were extracted from all our data sets. For each unique ORF, the read density was plotted across the entire predicted mRNA, then normalized to an mRNA length of 1000 nt. The average read density across all mRNAs was then plotted. Results for RNAi lines are compared with wild type, as indicated on the individual panels (AE).
FIGURE 3.
FIGURE 3.
Effect of RNAi on the half-lives of trypanosome mRNAs. The half-life of the mRNA from each unique ORF in cells with RNAi is plotted against the half-life that was previously measured for wild-type cells, on a log scale. The dashed diagonal indicates perfect correlation. All half-lives >240 min were set to 240 min, and all ORFs with a steady-state RPM of <5 for any of the cell lines were excluded from the data set. RNAi was as follows: (A) PAN2; (B) RRP45; (C) CAF1; (D) CNOT10.
FIGURE 4.
FIGURE 4.
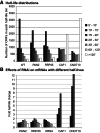
Effect of RRP45, PAN2, and CAF1/NOT complex depletion on mRNA decay. (A) Effects on the overall half-life distribution. Each unique ORF was placed in a half-life category as indicated in the key on the right. The numbers of ORFs in each category are displayed. (B) The half-life for each unique ORF after RNAi was divided by the half-life in wild type. The ORFs were then organized into categories depending on the wild-type half-life, and the average change in half-life after RNAi was calculated. The differences between the means of the categories for all RNAi lines were significant (one-way ANOVA on linearized data P-value <1 × 10⁻¹⁶).
FIGURE 5.
FIGURE 5.
Changes in mRNA half-lives after RNAi do not lead to corresponding changes in mRNA abundance. The mRNA half-life after RNAi (in minutes) was divided by that in wild-type cells and plotted on the x-axis (log10); the mRNA abundance after RNAi (average RPM reads) was divided by that in wild-type cells and plotted on the y-axis (log10). mRNAs with half-lives >240 min were excluded. Trend lines were plotted in Excel. (A) CNOT10 RNAi; (B) PAN2 RNAi; (C) RRP45 RNAi.
FIGURE 6.
FIGURE 6.
The effects of RNAi against PAN2 and RRP45 on genes encoding proteins of different functional classes. All unique ORFs were assigned into categories according to the function of the encoded protein. Those with mRNA stabilization or destabilization of at least twofold were selected, and the relative enrichment of each functional class was then calculated. Rows represent gene classes; columns represent the stabilized or destabilized mRNA. Each rectangle is colored to represent the log P-values for the enrichment of the corresponding functional category, according to Fisher’s test. The darker the pink color, the more significant the enrichment (see key).
FIGURE 7.
FIGURE 7.
Some mRNAs are stabilized in all RNAi lines. The ORFs with at least twofold increased half-lives were selected for each RNAi line. The Venn diagram shows the overlaps between the different lines. The complete gene set is represented by the largest circle.

References

    1. Acestor N, Panigrahi A, Ogata Y, Anupama A, Stuart K 2009. Protein composition of Trypanosoma brucei mitochondrial membranes. Proteomics 9: 5497–5508 - PMC - PubMed
    1. Alibu VP, Storm L, Haile S, Clayton C, Horn D 2004. A doubly inducible system for RNA interference and rapid RNAi plasmid construction in Trypanosoma brucei. Mol Biochem Parasitol 139: 75–82 - PubMed
    1. Anders S, Huber W 2010. Differential expression analysis for sequence count data. Genome Biol 11: R106. - PMC - PubMed
    1. Banerjee S, Pedersen T 2003. The design, implementation and use of the Ngram statistic package. In Proceedings of the fourth international conference on intelligent text processing and comparative linguistics, 370–381, Mexico City
    1. Banerjee H, Palenchar J, Lukaszewicz M, Bojarska E, Stepinski J, Jemielity J, Guranowski A, Ng S, Wah D, Darzynkiewicz E, et al. 2009. Identification of the HIT-45 protein from Trypanosoma brucei as an FHIT protein/dinucleoside triphosphatase: Substrate specificity studies on the recombinant and endogenous proteins. RNA 15: 1554–1564 - PMC - PubMed

Publication types

MeSH terms