

Respiratory disease in relation to outdoor air pollution in Kanpur, India
- PMID: 23697693
- PMCID: PMC3678152
- DOI: 10.1080/19338244.2012.701246
Respiratory disease in relation to outdoor air pollution in Kanpur, India
Abstract
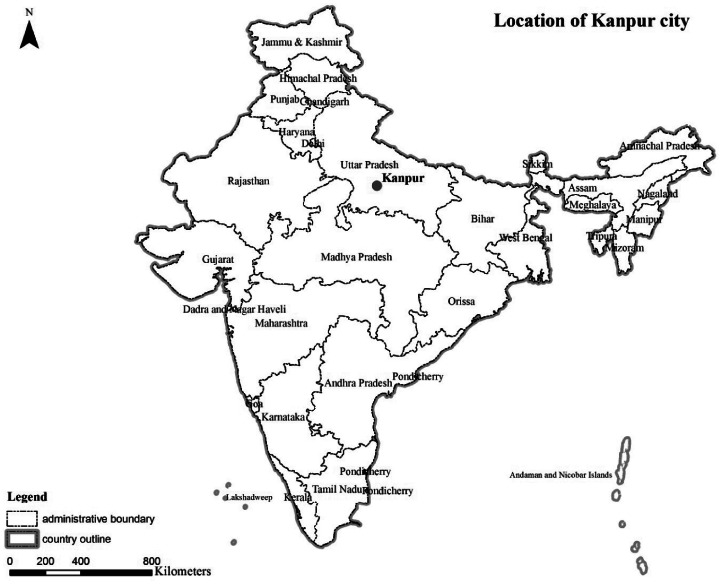
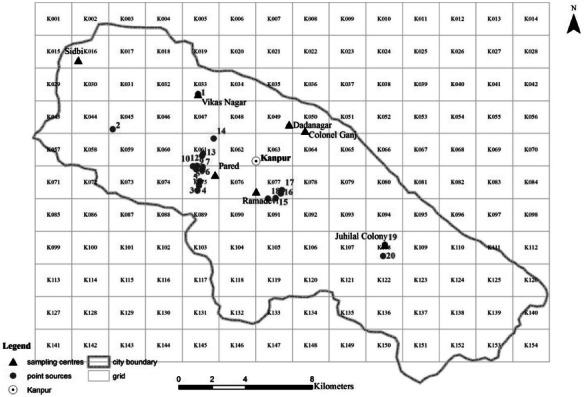
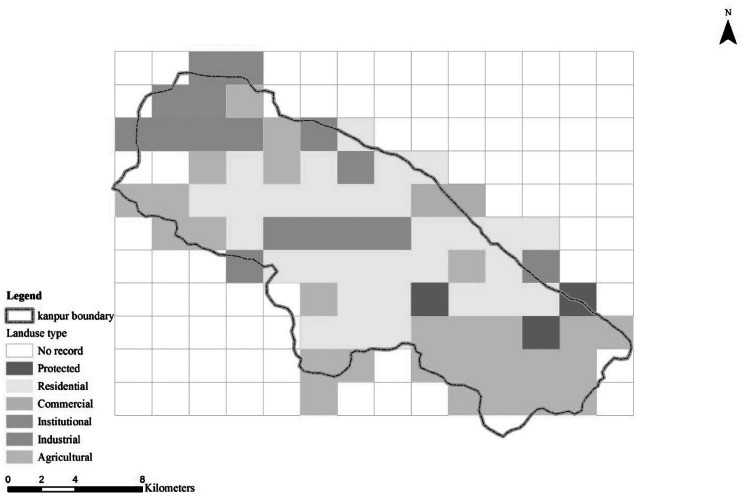
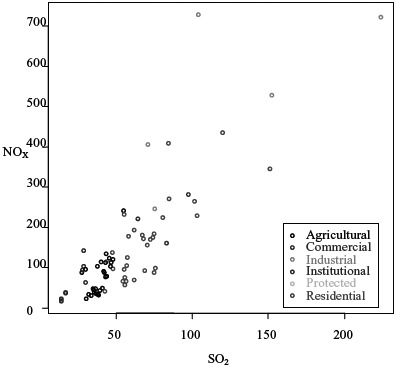
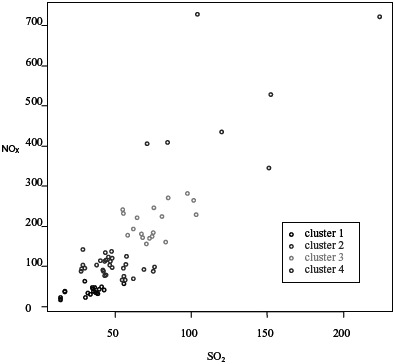
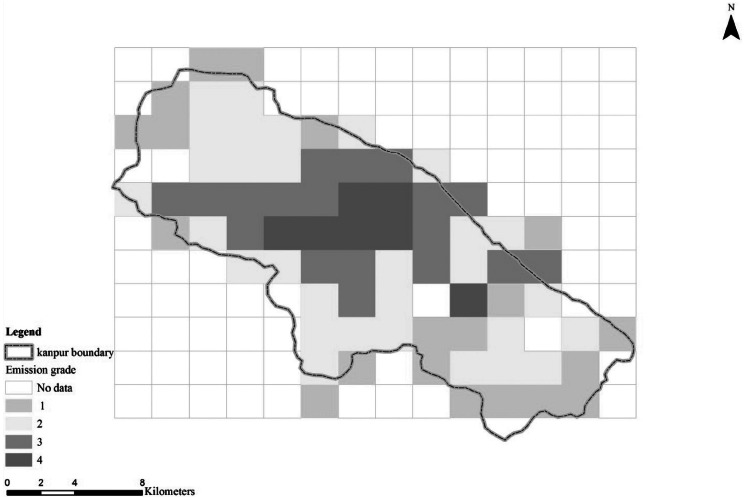
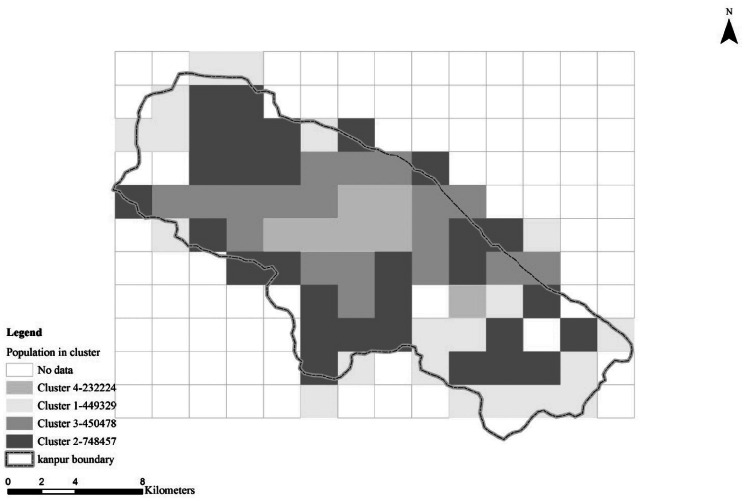
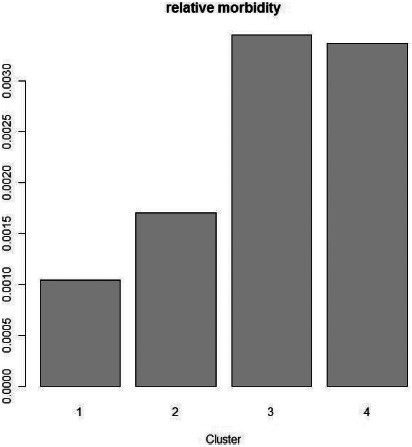
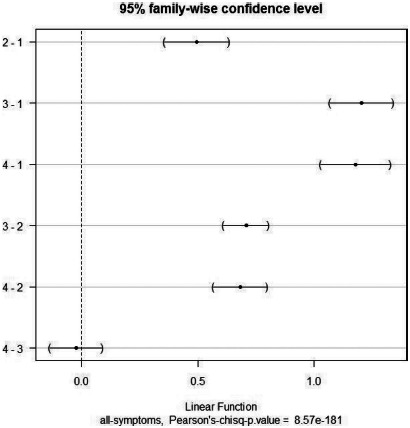
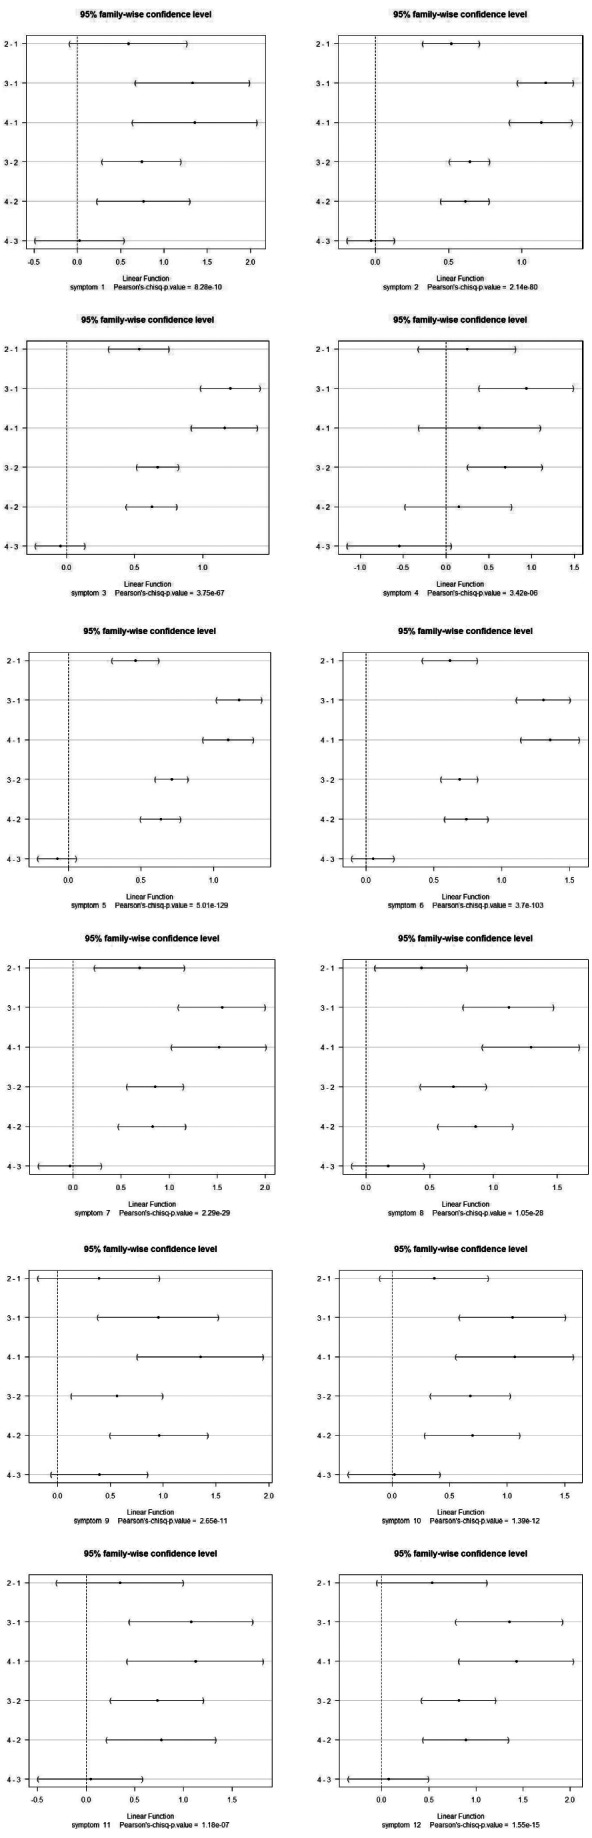
This paper examines the effect of outdoor air pollution on respiratory disease in Kanpur, India, based on data from 2006. Exposure to air pollution is represented by annual emissions of sulfur dioxide (SO(2)), particulate matter (PM), and nitrogen oxides (NO(x)) from 11 source categories, established as a geographic information system (GIS)-based emission inventory in 2 km × 2 km grid. Respiratory disease is represented by number of patients who visited specialist pulmonary hospital with symptoms of respiratory disease. The results showed that (1) the main sources of air pollution are industries, domestic fuel burning, and vehicles; (2) the emissions of PM per grid are strongly correlated to the emissions of SO(2) and NO(x); and (3) there is a strong correlation between visits to a hospital due to respiratory disease and emission strength in the area of residence. These results clearly indicate that appropriate health and environmental monitoring, actions to reduce emissions to air, and further studies that would allow assessing the development in health status are necessary.
Figures
References
-
- Pope CA, III, Thun MJ, Namboodiri MM, et al. Particulate air pollution as a predictor of mortality in a prospective study of U.S. Adults. Am J Respir Crit Care Med. 1995;151:669–674. - PubMed
-
- Brook RD, Rajagopalan S, Pope CA III, et al. Particulate matter air pollution and cardiovascular disease: an update to the scientific statement from the American Heart Association. Circulation. 2010;121:2331–2378. - PubMed
-
- Sivertsen B World Health Organization. Air Quality Guidelines, Global Update 2005. Copenhagen, Denmark: WHO Regional Office for Europe; 2006. Global ambient air pollution concentrations, trends; pp. 31–59.
Publication types
MeSH terms
Substances
LinkOut - more resources
Full Text Sources
Other Literature Sources
Medical