

Fat and lean BMI reference curves in children and adolescents and their utility in identifying excess adiposity compared with BMI and percentage body fat
- PMID: 23697708
- PMCID: PMC3683820
- DOI: 10.3945/ajcn.112.053611
Fat and lean BMI reference curves in children and adolescents and their utility in identifying excess adiposity compared with BMI and percentage body fat
Abstract
Background: Body mass index (BMI) and percentage body fat (%BF) are widely used to assess adiposity. These indexes fail to account for independent contributions of fat mass (FM) and lean body mass (LBM) to body weight, which vary according to age, sex, pubertal status, and population ancestry in the pediatric population.
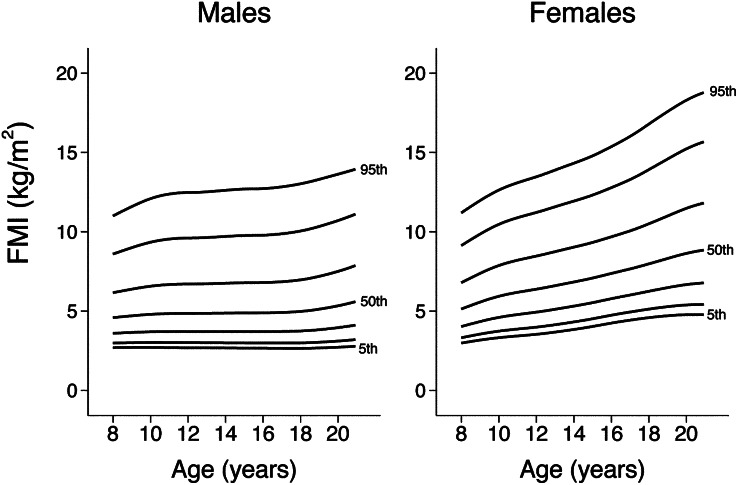
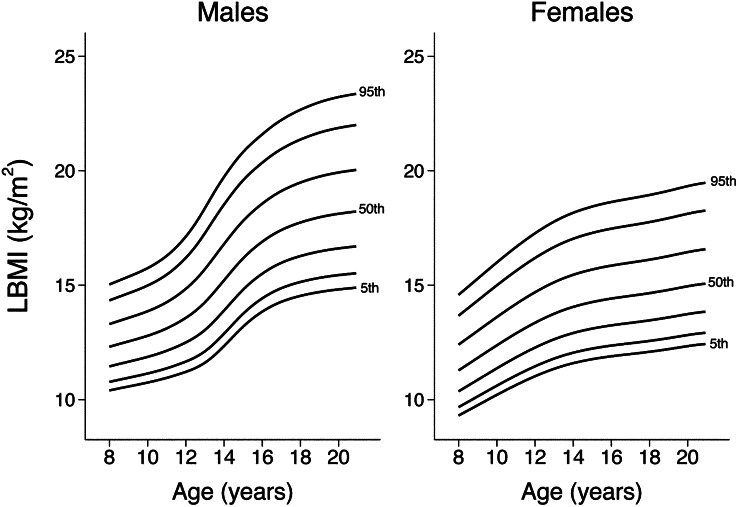
Objective: The objective was to develop pediatric reference curves for fat mass index (FMI) and lean body mass index (LBMI) and evaluate the effects of population ancestry and LBM on measures of excess adiposity (BMI, %BF, and FMI).
Design: Sex-specific FMI and LBMI reference curves relative to age for children and adolescents aged 8-20 y were generated from cross-sectional body-composition data measured by dual-energy X-ray absorptiometry from NHANES.
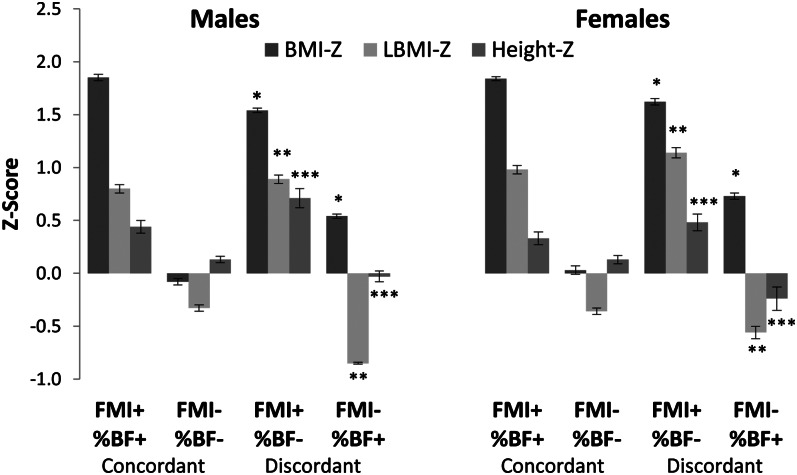
Results: The mean LBMI z score was higher in blacks (males: 0.26; females: 0.45) than in whites (males: -0.07; females: -0.09) and Mexican Americans (males: 0.05; females: -0.09). The positive predictive value of overweight by BMI to identify excess adiposity defined by FMI was lower in blacks (males: 35.9%; females: 30.3%) than in whites (males: 65.4%; females: 52.2%) and Mexican Americans (males: 73.3%; females: 68.3%). Participants classified as having excess adiposity by FMI but normal adiposity by %BF had significantly higher BMI, LBMI, and height z scores than did those classified as having excess adiposity by %BF but normal adiposity by FMI.
Conclusions: Relative to FMI, the prevalence of excess adiposity is overestimated by BMI in blacks and underestimated by %BF in individuals with high LBM. The use of FMI and LBMI improves on the use of %BF and BMI by allowing for the independent assessment of FM and LBM.
Figures
Comment in
-
Pediatric body composition references: what's missing?Am J Clin Nutr. 2013 Jul;98(1):1-3. doi: 10.3945/ajcn.113.064907. Epub 2013 May 29. Am J Clin Nutr. 2013. PMID: 23719556 Free PMC article. No abstract available.
-
The fat mass index: why its height exponent should be 3 and not 2.Am J Clin Nutr. 2013 Nov;98(5):1367. doi: 10.3945/ajcn.113.068205. Am J Clin Nutr. 2013. PMID: 24142239 No abstract available.
-
Reply to RF Burton.Am J Clin Nutr. 2013 Nov;98(5):1368-9. doi: 10.3945/ajcn.113.068379. Am J Clin Nutr. 2013. PMID: 24142240 Free PMC article. No abstract available.
Similar articles
-
Reference Centiles for the Evaluation of Nutritional Status in Children using Body Fat Percentage, Fat Mass and Lean Body Mass Index.J Clin Densitom. 2020 Jul-Sep;23(3):349-363. doi: 10.1016/j.jocd.2019.02.002. Epub 2019 Feb 7. J Clin Densitom. 2020. PMID: 30827819
-
Reference Values of Total Lean Mass, Appendicular Lean Mass, and Fat Mass Measured with Dual-Energy X-ray Absorptiometry in a Healthy Mexican Population.Calcif Tissue Int. 2016 Nov;99(5):462-471. doi: 10.1007/s00223-016-0181-z. Epub 2016 Aug 2. Calcif Tissue Int. 2016. PMID: 27484026
-
Association of body composition with bone mineral density in northern Chinese men by different criteria for obesity.J Endocrinol Invest. 2015 Mar;38(3):323-31. doi: 10.1007/s40618-014-0167-5. Epub 2014 Sep 25. J Endocrinol Invest. 2015. PMID: 25252817
-
Excess body fat in obese and normal-weight subjects.Nutr Res Rev. 2012 Jun;25(1):150-61. doi: 10.1017/S0954422412000054. Epub 2012 May 25. Nutr Res Rev. 2012. PMID: 22625426 Review.
-
Are Lean Body Mass and Fat-Free Mass the Same or Different Body Components? A Critical Perspective.Adv Nutr. 2024 Dec;15(12):100335. doi: 10.1016/j.advnut.2024.100335. Epub 2024 Nov 5. Adv Nutr. 2024. PMID: 39510253 Free PMC article. Review.
Cited by
-
Neck fat and obstructive sleep apnea in obese adolescents.Sleep. 2021 Nov 12;44(11):zsab158. doi: 10.1093/sleep/zsab158. Sleep. 2021. PMID: 34165571 Free PMC article.
-
Inflammatory Markers Profile in Older Adolescents During Treatment with Selective Serotonin Reuptake Inhibitors.J Child Adolesc Psychopharmacol. 2021 Aug;31(6):439-444. doi: 10.1089/cap.2020.0140. Epub 2021 Jun 24. J Child Adolesc Psychopharmacol. 2021. PMID: 34166063 Free PMC article.
-
Infant body composition trajectories differ by in utero exposure to gestational diabetes mellitus: a prospective cohort from birth to 12 months.Am J Clin Nutr. 2025 Jan;121(1):40-49. doi: 10.1016/j.ajcnut.2024.10.020. Epub 2024 Nov 19. Am J Clin Nutr. 2025. PMID: 39577834
-
The prevalence and determinants of physical activity in secondary Vietnamese students: a hierarchical analysis.BMC Public Health. 2025 May 7;25(1):1694. doi: 10.1186/s12889-025-22308-z. BMC Public Health. 2025. PMID: 40335956 Free PMC article.
-
Insulin-like Growth Factor 1 and Adiponectin and Associations with Muscle Deficits, Disease Characteristics, and Treatments in Rheumatoid Arthritis.J Rheumatol. 2015 Nov;42(11):2038-45. doi: 10.3899/jrheum.150280. Epub 2015 Sep 1. J Rheumatol. 2015. PMID: 26329340 Free PMC article.
References
-
- World Health Organization. Obesity: preventing and managing the global epidemic. Report of a WHO consultation. World Health Organ Tech Rep Ser 2000;894:i–xii, 1–253. - PubMed
-
- Krebs NF, Himes JH, Jacobson D, Nicklas TA, Guilday P, Styne D. Assessment of child and adolescent overweight and obesity. Pediatrics 2007;120(suppl 4):S193–228. - PubMed
-
- Wells JC. A Hattori chart analysis of body mass index in infants and children. Int J Obes Relat Metab Disord 2000;24:325–9. - PubMed
-
- Maynard LM, Wisemandle W, Roche AF, Chumlea WC, Guo SS, Siervogel RM. Childhood body composition in relation to body mass index. Pediatrics 2001;107:344–50. - PubMed
Publication types
MeSH terms
Grants and funding
LinkOut - more resources
Full Text Sources
Other Literature Sources
Medical
Miscellaneous
