. 2013 Jun;10(2):199-210.
doi: 10.1089/zeb.2012.0821. Epub 2013 May 22.

Defining hepatic dysfunction parameters in two models of fatty liver disease in zebrafish larvae

Affiliations

Defining hepatic dysfunction parameters in two models of fatty liver disease in zebrafish larvae

Deanna L Howarth et al. Zebrafish. 2013 Jun.

Abstract

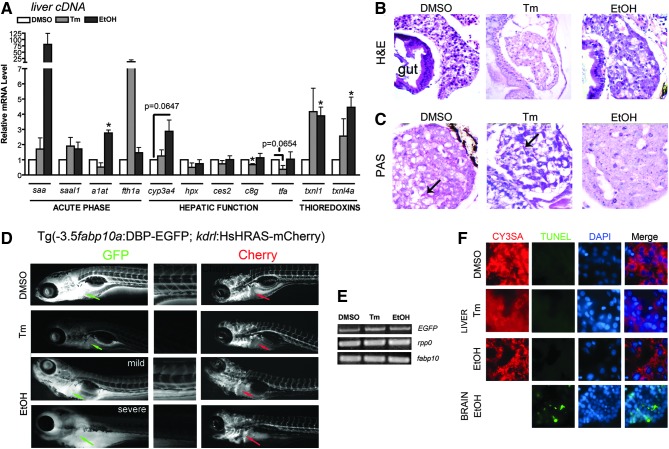
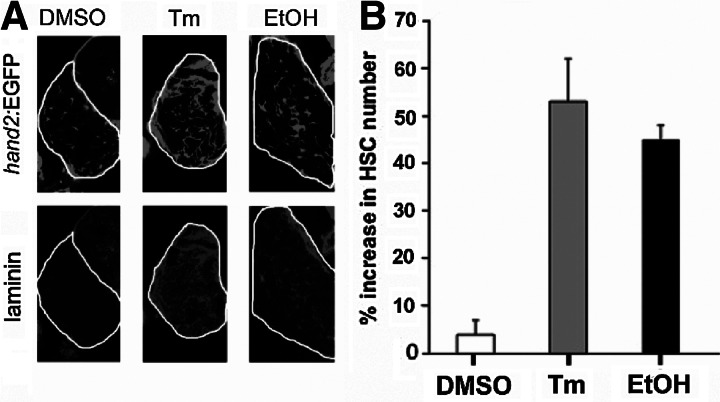
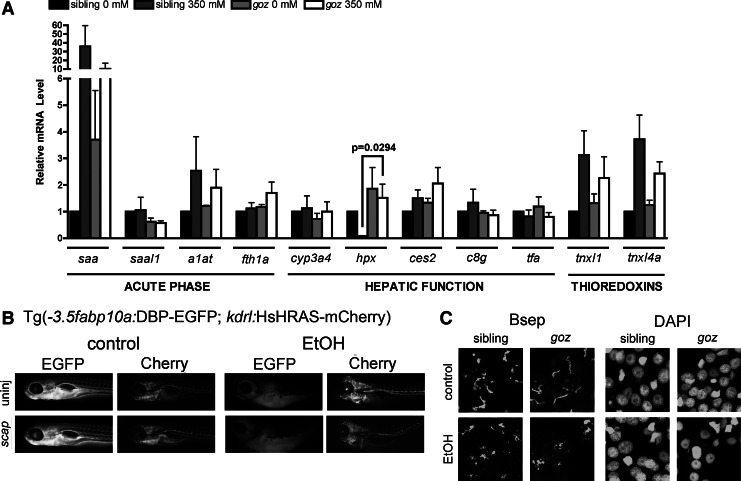
Fatty liver disease in humans can progress from steatosis to hepatocellular injury, fibrosis, cirrhosis, and liver failure. We developed a series of straightforward assays to determine whether zebrafish larvae with either tunicamycin- or ethanol-induced steatosis develop hepatic dysfunction. We found altered expression of genes involved in acute phase response and hepatic function, and impaired hepatocyte secretion and disruption of canaliculi in both models, but glycogen deficiency in hepatocytes and dilation of hepatic vasculature occurred only in ethanol-treated larvae. Hepatic stellate cells (HSCs) become activated during liver injury and HSC numbers increased in both models. Whether the excess lipids in hepatocytes are a direct cause of hepatocyte dysfunction in fatty liver disease has not been defined. We prevented ethanol-induced steatosis by blocking activation of the sterol response element binding proteins (Srebps) using gonzo(mbtps1) mutants and scap morphants and found that hepatocyte dysfunction persisted even in the absence of lipid accumulation. This suggests that lipotoxicity is not the primary cause of hepatic injury in these models of fatty liver disease. This study provides a panel of parameters to assess liver disease that can be easily applied to zebrafish mutants, transgenics, and for drug screening in which liver function is an important consideration.


Figures

FIG. 1.
FIG. 1.
Tunicamycin and ethanol cause hepatomegaly and steatosis in zebrafish larvae. (A) Representative brightfield images from control (dimethyl sulfoxide [DMSO]), tunicamycin (Tm), and ethanol-treated larvae expressing dsRed in hepatocytes (Tg:(fabp10:dsRed). (B) Representative whole mount oil red O images showing steatosis development in Tm and ethanol-treated larvae. The incidence of steatosis in each treatment regimen is noted. (C) Representative images from oil red O stained cryosections. Top images show location of the liver (circled) within the larvae. Bar=25 μm. Although hepatomegaly is a highly penetrant phenotype in both Tm and EtOH-treated fish,,, the section obtained for the Tm image was not through the widest region of the liver and therefore, does not reflect the actual liver size in this sample. Bottom images show accumulation of lipid droplets in hepatocytes of Tm and ethanol-treated larvae. Bar=10 μm.
FIG. 2.
FIG. 2.
Tunicamycin and ethanol induce hepatic dysfunction. (A) Quantitative, real-time PCR data from liver cDNAs of control (DMSO, white bars), Tm- (gray bars) and EtOH (black bars)-treated larvae. Genes are organized by function. Statistical significance was calculated using the 1-sample t-test. *p<0.05. Bars correspond to mean±SEM. (B) Hematoxylin and eosin staining of livers from DMSO, Tm, and EtOH-treated animals. (C) Periodic acid-Schiff's reagent staining for presence of glycogen. DMSO and Tm-treated larvae contain large glycogen depots (arrow), while EtOH-treated larvae have almost no hepatic glycogen. (D) Fluorescent images from live Tg(fabp10:DBP-EGFP; kdrl:HsHRAS-mCherry) larvae. Expression of DBP-EGFP is drastically reduced in Tm and EtOH-treated larvae but mCherry expression is not affected. Arrow points to the liver. To assist in visualization of DBP-EGFP secretion, a closeup of the tail region is shown. (E) Conventional PCR for EGFP, rpp0, and fabp10 for each treatment. The levels of EGFP mRNA do not correspond to the drastic GFP loss seen in live fish after Tm and EtOH treatment. (F) TUNEL assay for apoptosis. No hepatic apoptosis was observed in any treatment; however, apoptosis was noted in the brain after EtOH treatment.
FIG. 3.
FIG. 3.
Biliary alterations by Tm and EtOH. (A) Confocal Z-stack projections of liver labeled with anti-BSEP antibody (top panels) and counterstained with DAPI (bottom panels). Canaliculi from control livers present as long, narrow structures. Treatment with Tm and EtOH results in canalicular attenuation and dilation. Bar=10 μm. Numbers underneath each image correspond to the canaliculi:hepatic nuclei counted for 2–4 Z-stacks per treatment. (B) Live images from larvae treated with rhodamine and PED6 to assess bile secretion. Bile secretion was not affected by Tm or EtOH, as noted by the accumulation of PED6 in the gallbladder (arrow, gb). Bar=1 mm.
FIG. 4.
FIG. 4.
Hepatic stellate cells are activated by Tm and EtOH. (A) Single plane confocal images from Tg(hand2:EGFP) larvae with GFP-expressing HSCs (top panels) and labeled with anti-laminin antibody (bottom panels). Little laminin is visible in DMSO-treated larvae, but its deposition is significantly increased after Tm and EtOH treatment. Further, the number of HSCs is significantly increased by both treatments. (B) Quantification of percent increase in HSC number (average±SEM) during treatment with Tm and EtOH. For EtOH treatment, the numbers of HSCs in control and EtOH-treated larvae were counted 1 day after the treatment. Three separate treatments were performed. Total of 30 control and 30 EtOH-treated larvae were analyzed.
FIG. 5.
FIG. 5.
Reducing lipid accumulation in ALD does not improve hepatic function. (A) Quantitative, real-time PCR data from liver cDNAs from gozhi1487 mutants and their nonmutant siblings±EtOH. Statistical significance was calculated using two-way ANOVA with Bonferroni's post-hoc test. Bars correspond to mean±SEM. Significant p-values (p<0.05) correspond to the global effect of either dose or genotype, as noted. No interaction was found between dose and genotype in the ANOVA. (B) Fluorescent images from live Tg(fabp10:DBP-EGFP; kdrl:HsHRAS-mCherry) larvae with scap knockdown±EtOH. (C) Confocal Z-stack projections of liver labeled with anti-BSEP antibody and counterstained with DAPI. No difference in canalicular structure was noted between goz mutants and their nontransgenic siblings in the presence or absence of EtOH.

Similar articles

Cited by

References

    1. Lazo M. Clark JM. The epidemiology of nonalcoholic fatty liver disease: a global perspective. Semin Liver Dis. 2008;28:339–350. - PubMed
    1. Lazo M. Hernaez R. Bonekamp S. Kamel IR. Brancati FL. Guallar E, et al. Non-alcoholic fatty liver disease and mortality among US adults: prospective cohort study. BMJ. 2011;343:d6891. - PMC - PubMed
    1. Levene AP. Goldin RD. The epidemiology, pathogenesis and histopathology of fatty liver disease. Histopathology. 2012;61:141–152. - PubMed
    1. Romeo S. Kozlitina J. Xing C. Pertsemlidis A. Cox D. Pennacchio LA, et al. Genetic variation in PNPLA3 confers susceptibility to nonalcoholic fatty liver disease. Nat Genet. 2008;40:1461–1465. - PMC - PubMed
    1. Cohen JC. Horton JD. Hobbs HH. Human fatty liver disease: old questions and new insights. Science. 2011;332:1519–1523. - PMC - PubMed

Publication types

LinkOut - more resources