. 2013 Jul;24(14):2248-55.
doi: 10.1091/mbc.E12-12-0849. Epub 2013 May 22.

MicroRNA-185 oscillation controls circadian amplitude of mouse Cryptochrome 1 via translational regulation

Affiliations

MicroRNA-185 oscillation controls circadian amplitude of mouse Cryptochrome 1 via translational regulation

Kyung-Ha Lee et al. Mol Biol Cell. 2013 Jul.

Abstract

Mammalian circadian rhythm is observed not only at the suprachiasmatic nucleus, a master pacemaker, but also throughout the peripheral tissues. Investigation of the regulation of clock gene expression has mainly focused on transcriptional and posttranslational modifications, and little is known about the posttranscriptional regulation of these genes. In the present study, we investigate the role of microRNAs (miRNAs) in the posttranscriptional regulation of the 3'-untranslated region (UTR) of the mouse Cryptochrome 1 (mCry1) gene. Knockdown of Drosha, Dicer, or Argonaute2 increased mCry1-3'UTR reporter activity. The presence of the miRNA recognition element of mCry1 that is important for miR-185 binding decreased mCRY1 protein, but not mRNA, level. Cytoplasmic miR-185 levels were nearly antiphase to mCRY1 protein levels. Furthermore, miR-185 knockdown elevated the amplitude of mCRY1 protein oscillation. Our results suggest that miR-185 plays a role in the fine-tuned regulation of mCRY1 protein expression by controlling the rhythmicity of mCry1 mRNA translation.


Figures
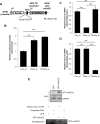
FIGURE 1:
FIGURE 1:
Cry1 expression is regulated by the miRNA machinery. (A) Schematic diagram of the reporter plasmid containing the full-length 3′UTR of mCry1. Full-length mCry1-3′UTR was fused to the Renilla luciferase reporter gene. Firefly luciferase was used as a transfection control. (B) Microporation was used to cotransfect NIH 3T3 cells with the Renilla luciferase mCry1-3′UTR reporter and siRNAs specific for Dicer1 (Dicer_si) or Drosha (Drosh_si). Nonspecific siRNA (Con_si) was used as a control. After 24 h, cells were harvested and dual-luciferase assays were performed using firefly luciferase as a transfection control. The activity of Con_si was set to 1 (n = 4; ***p < 0.0001). The relative mRNA levels of (C) Dicer1 and (D) Drosha were quantified by real-time PCR and normalized to mActb (n = 4; ***p < 0.0001). (E) The in vitro–transcribed mCry1-3′UTR construct was labeled with biotin-UTP and incubated with cytoplasmic extracts of GFP-mAGO2–overexpressing NIH 3T3 cells. Streptavidin affinity-purified samples were separated by SDS–PAGE and subjected to immunoblotting with anti-GFP or anti-GAPDH antibodies.
FIGURE 2:
FIGURE 2:
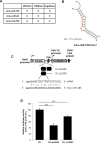
The miR-185–binding region of mCry1-3′UTR acts as a cis element in translation repression. (A) miRNA target prediction algorithms (MIRanda, MIRBase, and TargetScan) were applied to screen for miRNAs with the potential to bind the 3′UTR of mCry1. (B) Predictions of mCry1-3′UTR (lower strand) and miR-185 (upper strand) hybrids were performed using RNAhybrid software (http://bibiserv.techfak.uni-bielefeld.de/rnahybrid; Rehmsmeier et al., 2004). (C) Schematic representation of the reporter constructs. One or two copies of the miR-185 recognition element of mCry1-3′UTR (miR-185 MRE) were fused to the Renilla luciferase reporter gene. Firefly luciferase was used as a transfection control. (D) Luciferase activity was determined in NIH 3T3 cells transfected with RL (control), RL-2×185B, or RL-1×185B plasmids. The relative luciferase activity (ratio of RLUC/FLUC) was set to 100. Results shown are the mean ± SEM (n = 4; ***p < 0.0001).
FIGURE 3:
FIGURE 3:
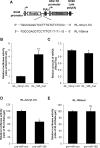
miR-185 overexpression represses translation. (A) NIH 3T3 cells were cotransfected with RL-2×185B plasmids and control pSi or miR-185-expressing plasmids (pSi-miR185). After 24 h, dual-luciferase assays were performed. The RLUC/FLUC ratio of pSi was set to 100 (n = 4; *p < 0.05, p = 0.0189). (B) Real-time PCR was used to quantify miR-185 mRNA levels in NIH 3T3 cells cotransfected with RL-2×185B plasmids and pSi or pSi-miR185 plasmids. miR-185 mRNA levels were normalized to mActb mRNA levels. Relative miR-185 levels of pSi were set to 1 (***p < 0.0001; unpaired t test). (C) NIH 3T3 cells were cotransfected with RL-mCry1-3U (full-length mCry1-3′UTR) and pre–miR-con or pre–miR-185 plasmids. After 24 h, luciferase assays were performed (n = 4; ***p < 0.0001). (D) Real-time PCR was used to determine the Rluc mRNA levels in NIH 3T3 cells cotransfected with RL-mCry1-3U (full-length mCry1-3′UTR) and pre–miR-con or pre–miR-185. Rluc mRNA levels were normalized to Fluc mRNA levels. The relative luciferase activity (RLUC/FLUC) of pre–miR-con was set to 1 (n = 6; p = 0.0587). (E) The overexpression of miR-185 was confirmed by real-time PCR (n = 4; ***p < 0.0001). Data shown in C–E represent the mean ± SEM.
FIGURE 4:
FIGURE 4:
Modulation of the miR-185–binding site increases translation. (A) The naive (wild-type) full-length mCry1-3′UTR sequence containing the miR-185 target site was amplified and ligated into a pRL reporter vector (pRL-mCry1-3U). A plasmid containing the full-length mCry1-3′UTR with a selected point mutation in the miR-185 target sequence (pRL-185-mut) was also constructed. (B) Luciferase reporter assays were performed using NIH 3T3 cells transfected with pRL-mCry1-3U or pRL-185-mut. The relative luciferase activity of RL-mCry1-3U was set to 1 (n = 4; p = 0.0047). (C) Total RNA extracted from NIH 3T3 cells transfected with pRL-mCry1-3U or pRL-185-mut were subjected to real-time PCR to determine the relative Rluc mRNA levels (ratio of Rluc/Fluc; n = 4; p = 0.0465). (D) Luciferase assays were performed in NIH 3T3 cells cotransfected with pRL-mCry1-3U and pre–miR-con or pre-miR-185 (n = 3; p = 0.0165). (E) Luciferase assays were performed in NIH 3T3 cells cotransfected with pRL-185-mut and pre–miR-con or pre–miR-185 (n = 3; p = 0.9928). Data shown represent the mean ± SEM.
FIGURE 5:
FIGURE 5:
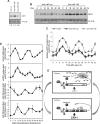
Cytoplasmic miR-185 oscillation regulates CRY1 expression. (A) CRY1 and 14-3-3ζ expression in NIH 3T3 cells transfected with control siRNA (Con_si), anti-miR-185, or pre–miR-185 were determined by immunoblotting. (B) Anti–miR-con and anti–miR-185–transfected NIH 3T3 cells were synchronized with dexamethasone treatment for 2 h. Then cells were harvested at the indicated time points and subjected to immunoblotting for CRY1 and 14-3-3ζ expression. (C) The relative mCRY1 levels in water-treated (x marks/dashed line), anti–miR-con–transfected (closed squares/solid line), and anti–miR-185–transfected (open circles/dotted line) NIH 3T3 cells. CRY1 levels were normalized to 14-3-3ζ and plotted. mCRY1 protein levels were not significantly different at any time point between water-treated and anti–miR-con–transfected cells (p > 0.05). mCRY1 protein levels were significantly different between the anti–miR-con–transfected and anti–miR-185–transfected groups except at the 0-, 4-, 20-, 24-, and 40-h dexamethasone treatment time points. (D) The rhythmic mCry1 mRNA profiles of anti–miR-con– and anti–miR-185–transfected NIH 3T3 cells (top). Real-time PCR results were calculated using the ratio of mCry1/mTbp. The protein profiles of water-treated, anti–miR-con–transfected, and anti–miR-185–transfected NIH 3T3 cells were quantified and plotted by time (second from top). Cytoplasmic and nuclear miR-185 levels in synchronized NIH 3T3 cells transfected with anti–miR-con and anti–miR-185 (bottom). Cells were treated with dexamethasone for the indicated time points, and cytoplasmic and nuclear extracts were obtained under RNase-free conditions. miR-185, miR-106a, and sno-202 levels were measured by real-time PCR. The cytoplasmic miR-185 levels were normalized to miR-106a, whereas nuclear miR-185 levels were normalized to sno-202. Data shown represent the mean ± SEM. (E) The proposed model for cytosolic miR-185–mediated rhythmic mCry1 translational regulation. Increased cytosolic miR-185 binds to the 3′UTR of mCry1 and inhibits mCry1 translation. When cytosolic miR-185 levels are reduced, miR-185–mediated mCry1 translational inhibition does not occur, and mCRY1 protein is increased.

Similar articles

Cited by

References

    1. Bartel DP. MicroRNAs: genomics, biogenesis, mechanism, and function. Cell. 2004;116:281–297. - PubMed
    1. Bartel DP. MicroRNAs: target recognition and regulatory functions. Cell. 2009;136:215–233. - PMC - PubMed
    1. Bushati N, Cohen SM. microRNA functions. Annu Rev Cell Dev Biol. 2007;23:175–205. - PubMed
    1. Chi SW, Zang JB, Mele A, Darnell RB. Argonaute HITS-CLIP decodes microRNA-mRNA interaction maps. Nature. 2009;460:479–486. - PMC - PubMed
    1. Cullen BR. Transcription and processing of human microRNA precursors. Mol Cell. 2004;16:861–865. - PubMed

Publication types

MeSH terms

LinkOut - more resources