. 2013 Jul;24(14):2171-85.
doi: 10.1091/mbc.E12-08-0626. Epub 2013 May 22.

SHIP2 regulates epithelial cell polarity through its lipid product, which binds to Dlg1, a pathway subverted by hepatitis C virus core protein

Affiliations

SHIP2 regulates epithelial cell polarity through its lipid product, which binds to Dlg1, a pathway subverted by hepatitis C virus core protein

Aline Awad et al. Mol Biol Cell. 2013 Jul.

Abstract

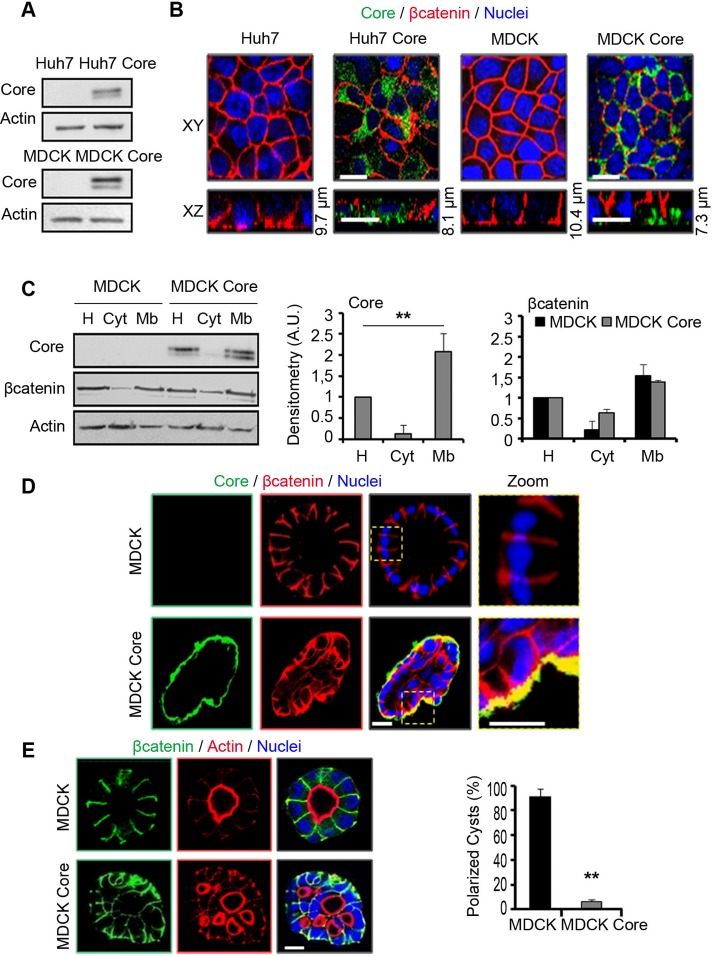
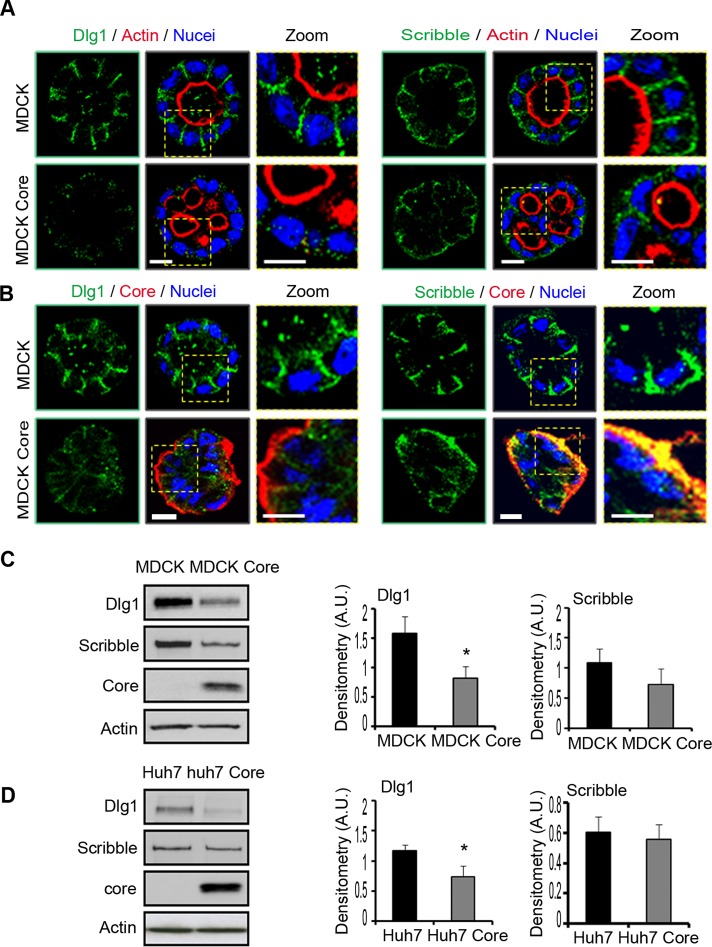
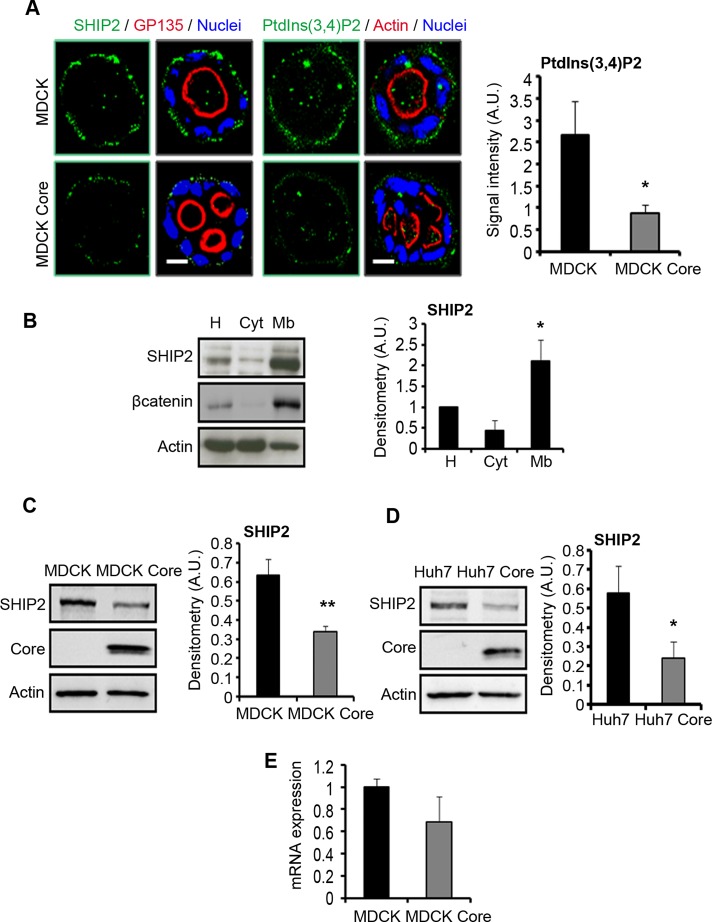
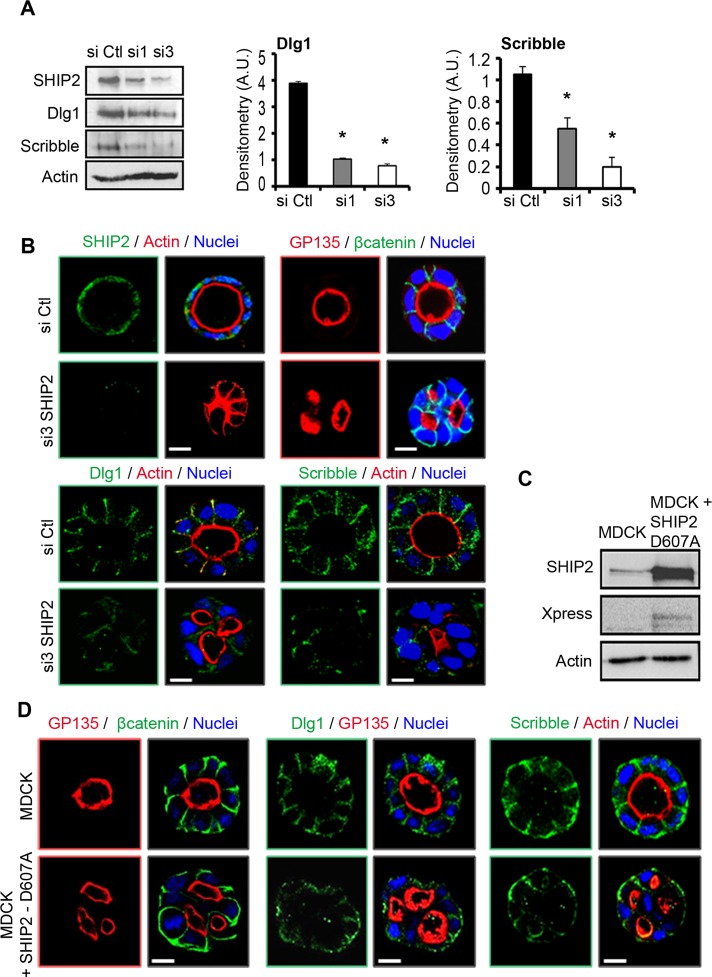
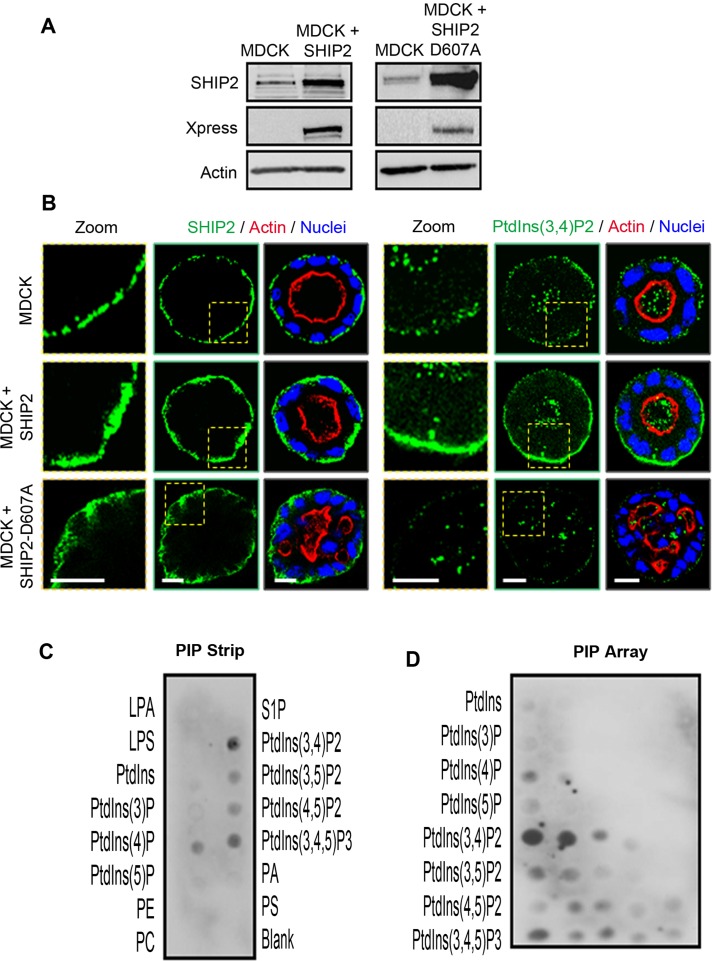
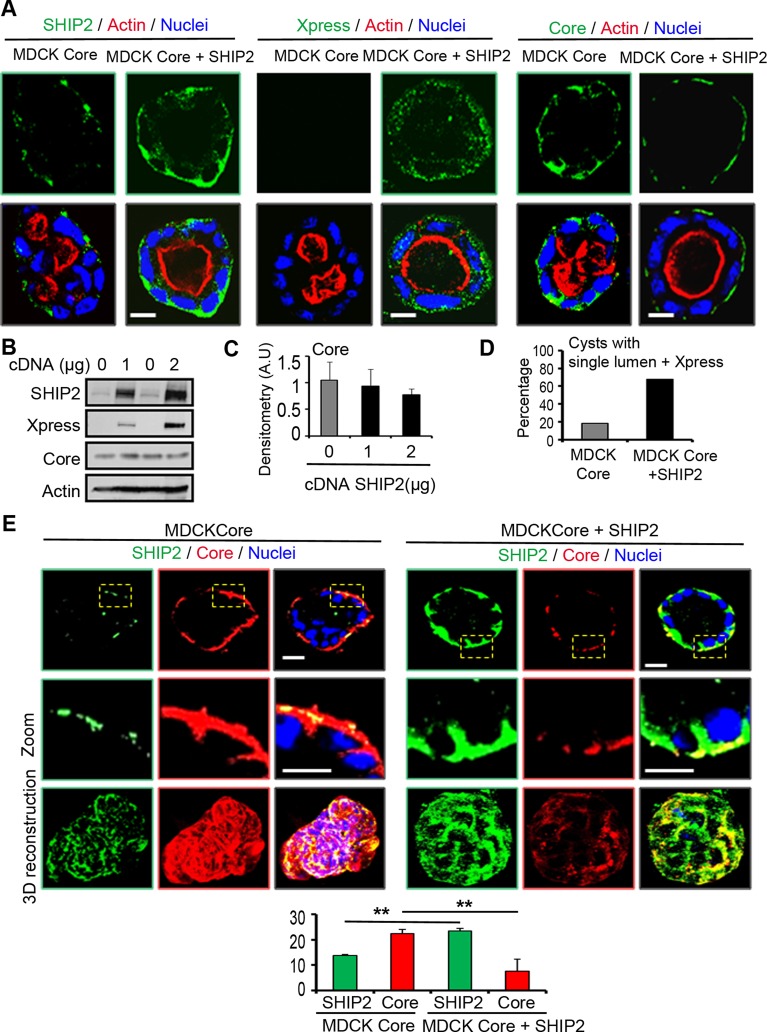
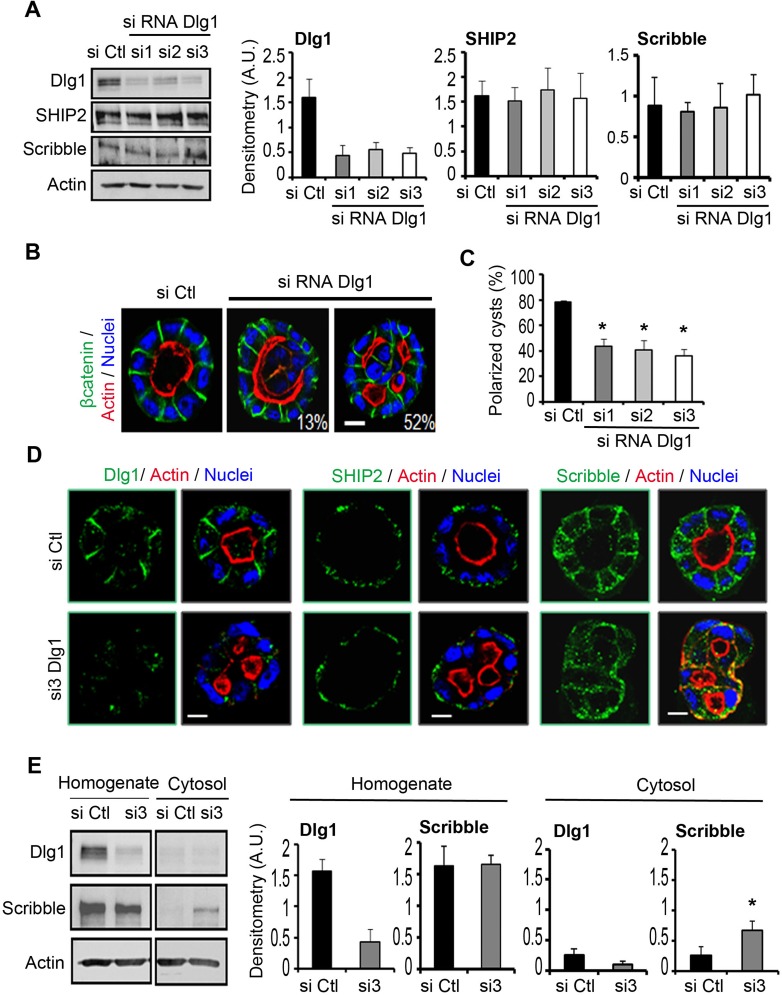
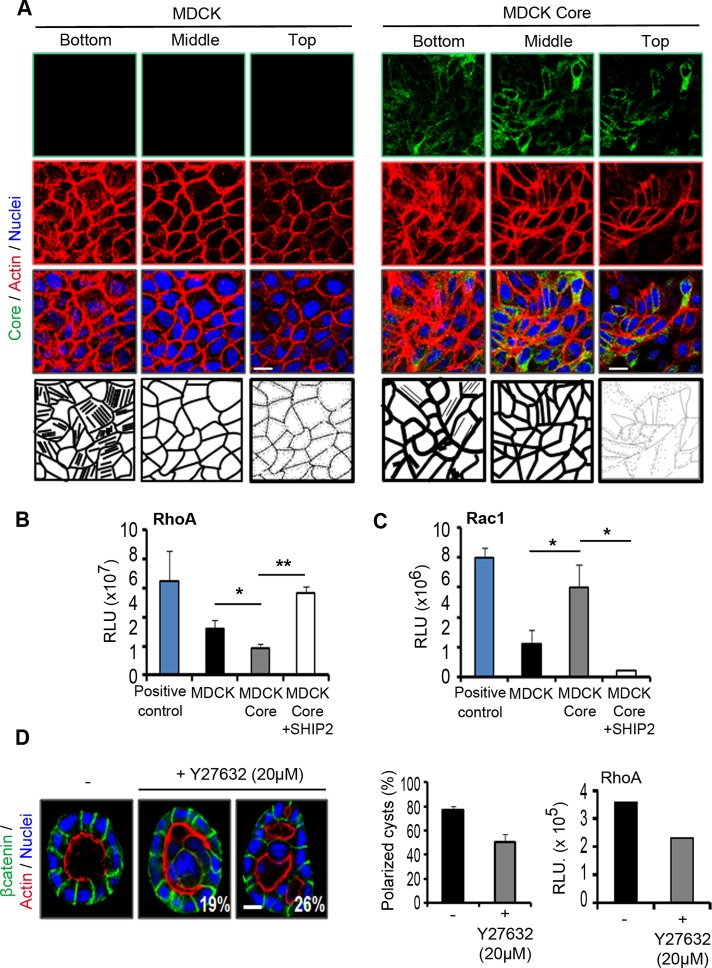
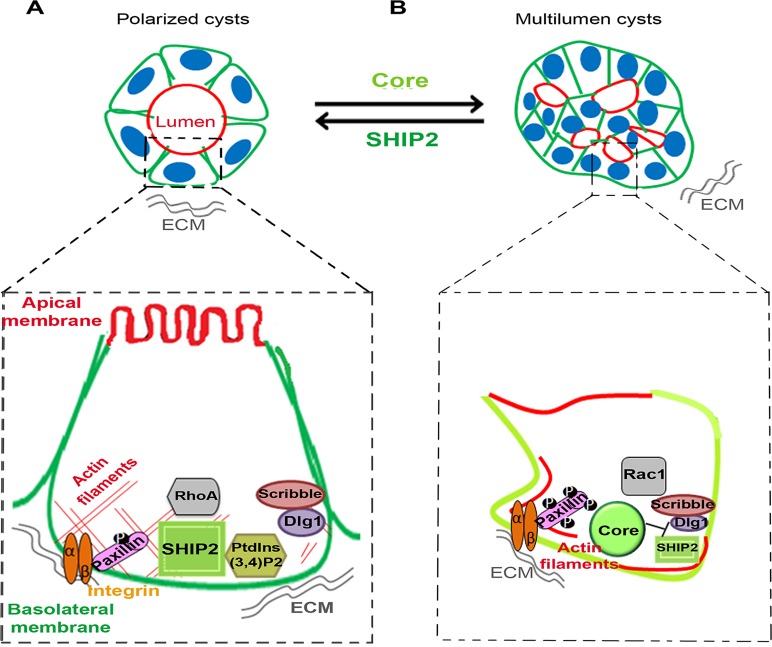
The main targets of hepatitis C virus (HCV) are hepatocytes, the highly polarized cells of the liver, and all the steps of its life cycle are tightly dependent on host lipid metabolism. The interplay between polarity and lipid metabolism in HCV infection has been poorly investigated. Signaling lipids, such as phosphoinositides (PIs), play a vital role in polarity, which depends on the distribution and expression of PI kinases and PI phosphatases. In this study, we report that HCV core protein, expressed in Huh7 and Madin-Darby canine kidney (MDCK) cells, disrupts apicobasal polarity. This is associated with decreased expression of the polarity protein Dlg1 and the PI phosphatase SHIP2, which converts phosphatidylinositol 3,4,5-trisphosphate into phosphatidylinositol 4,5-bisphosphate (PtdIns(3,4)P2). SHIP2 is mainly localized at the basolateral membrane of polarized MDCK cells. In addition, PtdIns(3,4)P2 is able to bind to Dlg1. SHIP2 small interfering RNA or its catalytically dead mutant disrupts apicobasal polarity, similar to HCV core. In core-expressing cells, RhoA activity is inhibited, whereas Rac1 is activated. Of interest, SHIP2 expression rescues polarity, RhoA activation, and restricted core level in MDCK cells. We conclude that SHIP2 is an important regulator of polarity, which is subverted by HCV in epithelial cells. It is suggested that SHIP2 could be a promising target for anti-HCV treatment.


Figures

FIGURE 1:
FIGURE 1:
HCV core protein is present mainly at the basal membrane and disrupts polarity. (A) Immunoblot analysis of core protein stably expressed in Huh7 and MDCK cells compared with nontransfected cells used as control. Actin is used as loading control. (B) Huh7 and MDCK cells, expressing or not expressing HCV core protein, were grown on filters as a monolayer for 3 d and then fixed, stained for core (green) and β-catenin (red) as indicated, and imaged by confocal microscopy. Nuclei were stained with Hoechst. XY and XZ sections are presented. Scale bar, 10 μm. (C) Homogenates (H) from MDCK and MDCK core cells grown for 3 d were submitted to ultracentrifugation at 100,000 × g to separate membrane (Mb) from cytosolic (Cyt) compartments and analyzed by immunoblotting for core, β-catenin, and actin used as loading control. The densitometry analysis normalized to actin from three independent experiments is represented in arbitrary units (A.U.). Error bars, SD. **p < 0.001. (D) MDCK cells expressing or not expressing HCV core protein were grown in Matrigel for 4 d to form cysts and then stained for core (green), β-catenin (red), and nuclei (blue) with Hoechst as indicated. Single confocal section through the middle of a cyst. Right, a zoom. Scale bar, 10 μm. (E) Cells in D stained for β-catenin (green), actin (red), and nuclei with Hoechst (blue). Single confocal section through the middle of a cyst. Scale bar, 10 μm. Percentage of polarized cysts with normal single lumen detected with actin staining is presented as a histogram. We counted 250 cysts from control and MDCK core cells in three independent experiments. Error bars, SD. **p < 0.001.
FIGURE 2:
FIGURE 2:
Dlg1 and Scribble are down-expressed in Huh7 and MDCK cells expressing HCV core protein. (A) MDCK cells expressing or not expressing HCV core protein were grown in Matrigel for 4 d to form cysts and stained for Dlg1 or Scribble (green) and actin (red) as indicated. Nuclei were stained with Hoechst (blue). Single confocal section through the middle of a cyst. Right, a zoom. Scale bar, 10 μm. (B) Cells in A stained for Dlg1 or Scribble (green) and core (red) as indicated. Nuclei were stained with Hoechst (blue). Single confocal section through the middle of a cyst. Right, a zoom. Scale bar, 10 μm. (C) The lysates of cells grown as in A analyzed by immunoblotting with antibodies to Dlg1, Scribble, and actin as loading control. Densitometry analysis normalized to actin from four independent experiments is represented in arbitrary units (A.U.) in histograms. Error bars, SD. *p < 0.05. (D) Huh7 cells expressing or not expressing HCV core protein were grown for 3 d and the cell lysates analyzed by immunoblotting toDlg1, Scribble, and actin as loading control. Densitometry analysis normalized to actin from three independent experiments is represented in arbitrary units (A.U.) in histograms. Error bars, SD. *p < 0.05.
FIGURE 3:
FIGURE 3:
SHIP2 and PtdIns(3,4)P2 are both localized to the basal membrane of polarized cysts and down-regulated in the presence of HCV core protein. (A) MDCK cells expressing or not expressing HCV core protein were grown for 4 d in Matrigel and stained for SHIP2 or PtdIns(3,4)P2 (green) and actin (red) as indicated. Nuclei (blue) were stained with Hoechst. Single confocal section through the middle of cyst. Scale bar, 10 μm. Staining intensity of PtdIns(3,4)P2 was quantified with ImageJ from 10 cysts in three independent experiments and is presented in histograms. Error bars, SD. *p < 0.05. (B) Homogenates (H) from MDCK cells grown for 3 d were submitted to ultracentrifugation at 100, 000 × g to separate membrane (Mb) and cytosolic (Cyt) fractions and immunoblotted for SHIP2, β-catenin, and actin as loading control. Densitometry analysis normalized to actin from three independent experiments is represented in arbitrary units (A.U.) in a histogram. Error bars, SD. *p < 0.05. (C) Lysates of cells grown as in A analyzed by immunoblotting with anti-SHIP2 and core. Actin is used as loading control. The densitometry analysis normalized to actin from four independent experiments is represented in arbitrary units (A.U.) in histograms. Error bars, SD. **p < 0.001. (D) Huh7 cells expressing or not expressing HCV core protein were grown for 3 d and cell lysates analyzed by immunoblotting with anti-SHIP2 and anti-actin as loading control. The densitometry analysis normalized to actin from three independent experiments is represented in arbitrary units (A.U.) in histograms. Error bars, SD. *p < 0.05. (E) Total RNA from MDCK cells expressing or not expressing HCV core protein analyzed by quantitative PCR for SHIP2 expression and normalized to GAPDH (see Materials and Methods). Data are means ± SEM of three experiments done in triplicate.
FIGURE 4:
FIGURE 4:
Depletion of SHIP2 or inhibition of its catalytic activity disrupts cell polarity. (A) Immunoblot analysis of SHIP2, Dlg1, and Scribble in cells treated with two different SHIP2-specific siRNAs (si1 and si3). Actin is used as loading control. Densitometry analysis normalized to actin from three independent experiments is represented in arbitrary units (A.U.) in histograms. Error bars, SD. *p < 0.05. (B) MDCK cells transfected or not (si Ctl) with SHIP2 siRNA (si3) grown in Matrigel for 4 d to form cysts and stained for SHIP2, β-catenin, Dlg1, or Scribble (green) and actin or GP135 (red) as indicated. Nuclei (blue) were stained with TO-PRO-3. Single confocal section through the middle of cyst. Scale bar, 10 μm. (C) Immunoblot analysis of SHIP2 in MDCK cells transfected or not (MDCK) with the cDNA of SHIP2 phosphatase-dead mutant (SHIP2-D607A). Xpress antibody was used to detect expressed tagged SHIP2. Actin is used as loading control. (D) The cells treated as in C grown in Matrigel for 4 d to form cysts and stained for β-catenin, Dlg1, or Scribble (green) and actin or GP135 (red) as indicated. Nuclei (blue) were stained with Hoechst. Single confocal section through the middle of a cyst. Scale bar, 10 μm.
FIGURE 5:
FIGURE 5:
SHIP2 produces PtdIns(3,4)P2, which binds to dlg1. (A) Immunoblot analysis of SHIP2 in MDCK cells transfected or not with cDNA SHIP2 or SHIP2 phosphatase-dead mutant (SHIP2-D607A). Xpress served to detect exogenous tagged SHIP2, and actin was used as loading control. (B) MDCK cells transfected or not (MDCK) with cDNA SHIP2 or SHIP2 phosphatase-dead mutant (SHIP2-D607A) grown in Matrigel for 4 d to form cysts and stained for SHIP2 or PtdIns(3,4)P2 (green) and actin (red) as indicated. Nuclei (blue) were stained with Hoechst. Single confocal section through the middle of a cyst. Left, a zoom. Scale bar, 10 μm. (C) PIP-Strips or (D) PIP array with the indicated immobilized phospholipids incubated with homogenates from MDCK cells grown for 48 h on culture dishes. Bound proteins were detected using anti-Dlg1 antibody followed by secondary antibody and luminescence detection as described in Materials and Methods.
FIGURE 6:
FIGURE 6:
SHIP2 rescues polarity and negatively controls core protein expression in MDCK core cells. (A) MDCK core transfected or not with 2 μg of Xpress-tagged SHIP2 cDNA grown for 4 d in Matrigel and stained for SHIP2, Xpress, or Core (green) and actin (red) as indicated. Nuclei were stained with Hoechst (blue). Single confocal section through the middle of a cyst. Scale bar, 10 μm. (B) MDCK core transfected or not with 1 or 2 μg of cDNA of SHIP2 was collected for analysis by Western blotting with SHIP2, core, and Xpress antibodies. Actin served as loading control. Core densitometry analysis normalized to actin of three independent experiments is represented in arbitrary units (A.U.) in histogram (C). Data are means, and error bars are SD. (D) Approximately 200 cells in A were counted. The percentage of polarized cysts with normal single lumen stained with actin and presenting also Xpress expression is represented in histogram. (E) Cells in A were stained for SHIP2 (green) and core (red) as indicated. Nuclei were stained with Hoechst (blue). Single confocal section through the middle of a cyst. Middle, a zoom. Scale bar, 10 μm. Bottom, 3D reconstruction. The staining intensity of Core and SHIP2 were quantified with ImageJ from 15 cysts in three independent experiments and is presented in histograms. Error bars, SD. **p < 0.001.
FIGURE 7:
FIGURE 7:
Dlg1 depleted cells form multilumen cysts. (A) MDCK cells transfected or not (si Ctl) with siRNA from Dlg1 (si1, si2, and si3) were grown for 3 d and cell lysates analyzed by immunoblotting with Dlg1, SHIP2, Scribble, and actin antibodies. The densitometry analysis from three independent experiments normalized to actin is represented in arbitrary units (A.U.) in histograms. Error bars, SD. *p < 0.05. (B) Cells transfected or not with si3 Dlg1 were grown for 4 d in Matrigel and stained for β-catenin (green) and actin (red) as indicated. Nuclei were stained with Hoechst (blue). Single confocal section through the middle of a cyst. Scale bar, 10 μm. Approximately 200 cells were counted from three independent experiments. The percentage of lumen-filled cysts and multilumen cysts is indicated. (C) Cells in A were grown for 4 d in Matrigel, and ∼200 cells were counted from three independent experiments. The percentage of polarized cysts with normal single lumen is represented in the histogram. Error bars, SD. *p < 0.05. (D) Cells treated as in B stained for Dlg1, Scribble, or SHIP2 (green) and actin (red) as indicated. Nuclei were stained with Hoechst (blue). Single confocal section through the middle of a cyst. Scale bar, 10 μm. (E) Homogenates from MDCK cells transfected or not with si3 Dlg1 were submitted to ultracentrifugation at 100,000 × g into separate cytosolic compartments and immunoblotted for Scribble and Actin as loading control. Densitometry analysis normalized to actin from three independent experiments is represented in arbitrary units (A.U.) in histograms. Error bars, SD. *p < 0.05.
FIGURE 8:
FIGURE 8:
HCV core affects actin organization and Rho-family GTPases activities. (A) MDCK cells expressing or not HCV core protein were grown for 3 d on coverslips and stained for core (green) and actin (red) as indicated. Nuclei (blue) were stained with Hoechst. Three confocal images are shown, at the bottom, middle, and top of the cell. Scale bar, 10 μm. Bottom, schematic image. (B) Extracts from MDCK core cells transfected or not with SHIP2 cDNA were used to quantify RhoA and Rac1 (C) activation using G-LISA Biochem Kit (luminescence based). Intensity was measured by luminometer at 0.3 s. Negative control intensity was reduced from sample intensity, as indicated in the protocol. RLU, relative light unit. Error bars, SD. *p < 0.05, **p < 0.001. (D) MDCK cells were grown on Matrigel, treated 24 h after plating with ROCK inhibitor Y27632 (20 μM) for 72 h, and fixed and stained for β-catenin (green) and actin (red) as indicated. Nuclei (blue) were stained with Hoechst. Scale bar, 10 μm. We counted 150 cysts from two independent experiments. Percentage of lumen-filled and multilumen cysts is indicated. The percentage of polarized cysts with normal single lumen is represented in the histogram. Error bars, SD. Cells in D were used to quantify RhoA activation as in B.
FIGURE 9:
FIGURE 9:
Schematic model of polarized cell and loss of polarity induced by the HCV core. (A) Polarized MDCK cyst showing an apical membrane toward the lumen and a basolateral membrane in contact with the extracellular matrix (ECM). A zoom is presented to illustrate SHIP2 at the basal membrane, underlining its enzymatic activity to produce PtdIns(3,4)P2 at the basolateral membrane and its role in cell polarity by activating RhoA, inducing stabilization of both cell–cell (Dlg1-Scribble) and cell–ECM (paxillin) contacts. (B) Multilumen cyst presenting the phenotype of cells expressing HCV core protein. A zoom is presented to illustrate the loss of cell polarity in cells expressing HCV core protein, indicating mutual antagonism between SHIP2 and core for localization at the basal membrane. Disorganization of focal contacts and increase of paxillin phosphorylation at tyrosine 118 and Rac1activity are also seen.

Similar articles

Cited by

References

    1. Alvisi G, Madan V, Bartenschlager R. Hepatitis C virus and host cell lipids: an intimate connection. RNA Biol. 2011;8:258–269. - PubMed
    1. Backers K, Blero D, Paternotte N, Zhang J, Erneux C. The termination of PI3K signalling by SHIP1 and SHIP2 inositol 5-phosphatases. Adv Enzyme Regul. 2003;43:15–28. - PubMed
    1. Barba G, et al. Hepatitis C virus core protein shows a cytoplasmic localization and associates to cellular lipid storage droplets. Proc Natl Acad Sci USA. 1997;94:1200–1205. - PMC - PubMed
    1. Bartenschlager R, Penin F, Lohmann V, André P. Assembly of infectious hepatitis C virus particles. Trends Microbiol. 2011;19:95–103. - PubMed
    1. Battaglia S, Benzoubir N, Nobilet S, Charneau P, Samuel D, Zignego AL, Atfi A, Bréchot C, Bourgeade MF. Liver cancer-derived hepatitis C virus core proteins shift TGF-beta responses from tumor suppression to epithelial-mesenchymal transition. PLoS One. 2009;4:e4355. - PMC - PubMed

Publication types

MeSH terms

Substances

LinkOut - more resources