. 2013 Jul;24(14):2186-200.
doi: 10.1091/mbc.E12-10-0737. Epub 2013 May 22.

Cells surviving fractional killing by TRAIL exhibit transient but sustainable resistance and inflammatory phenotypes

Affiliations

Cells surviving fractional killing by TRAIL exhibit transient but sustainable resistance and inflammatory phenotypes

Deborah A Flusberg et al. Mol Biol Cell. 2013 Jul.

Abstract

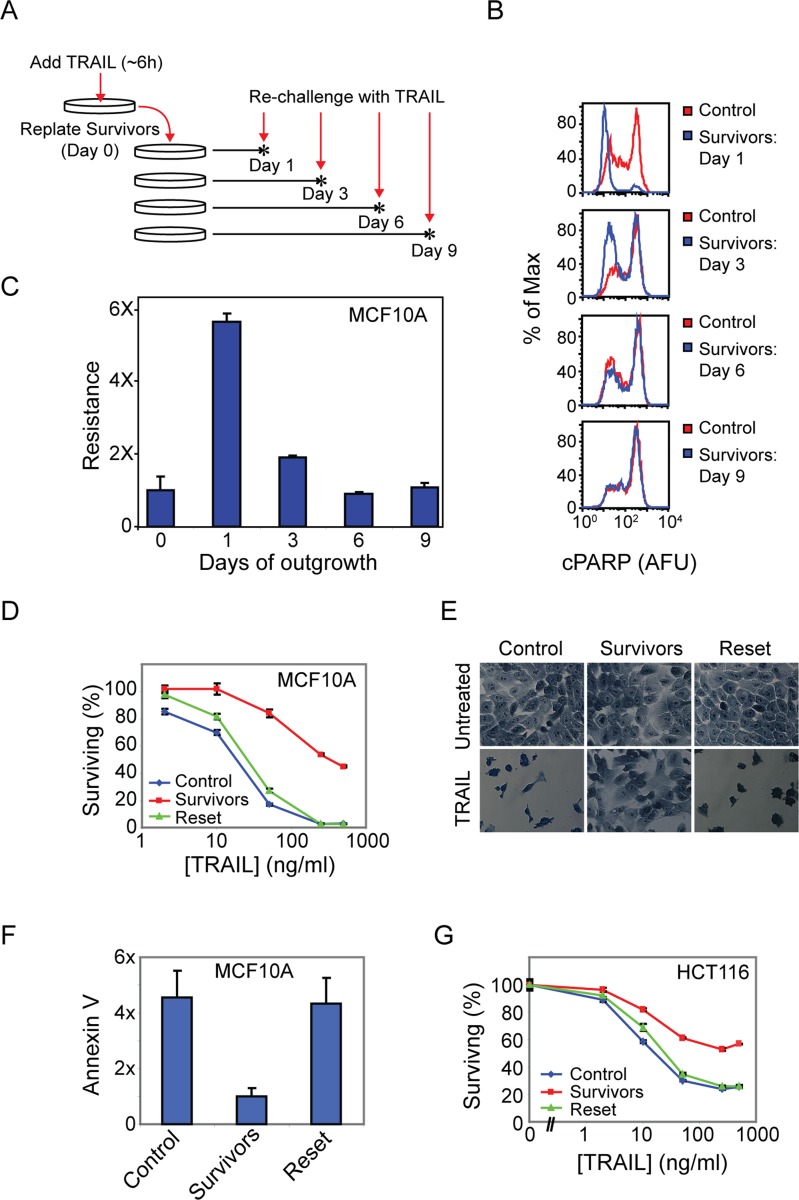
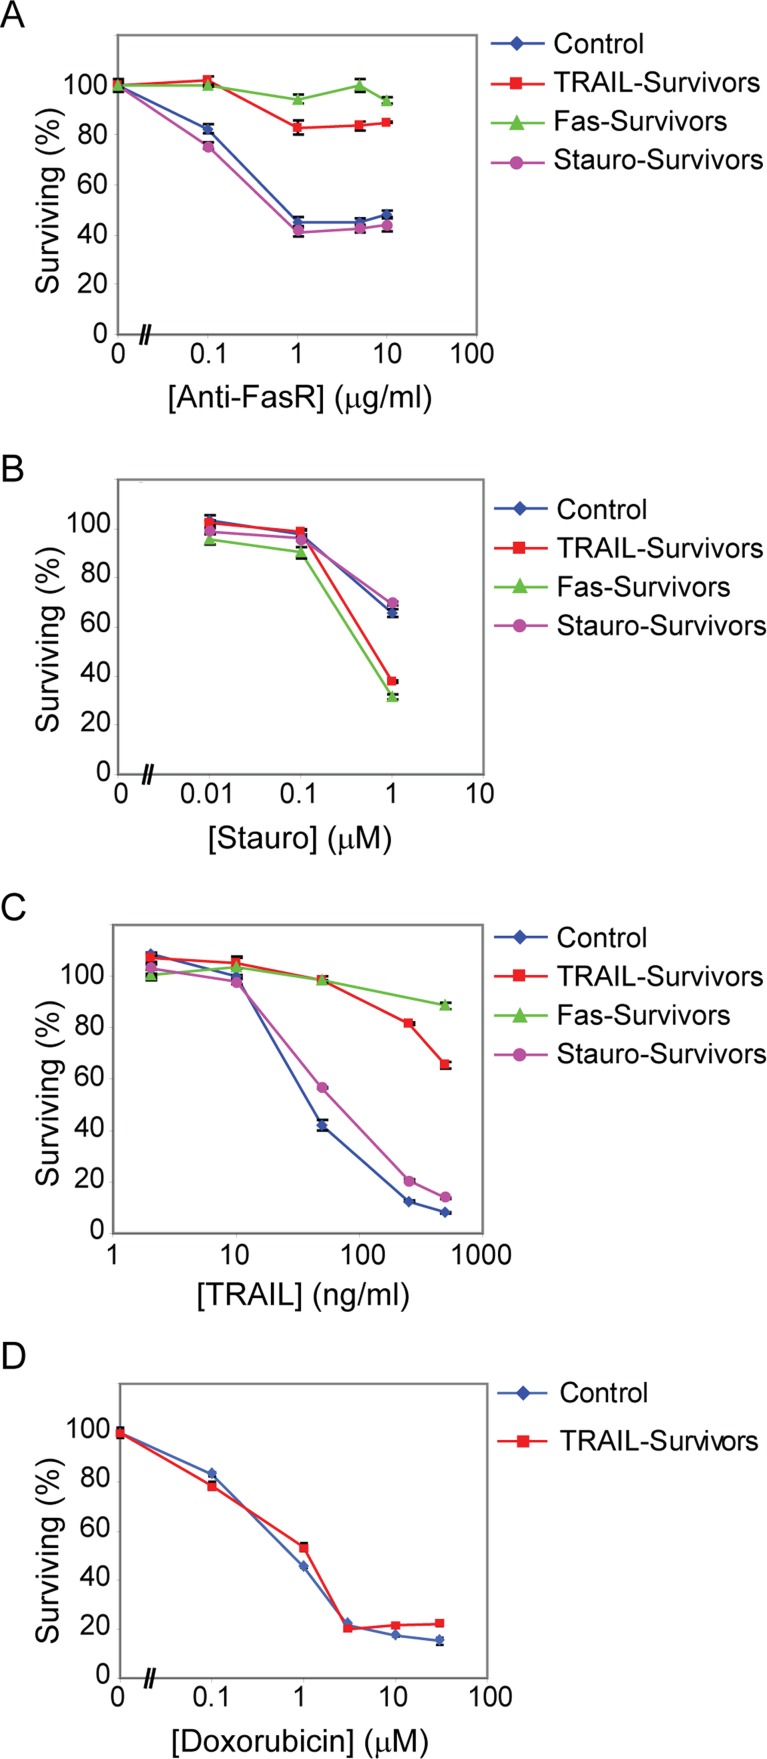
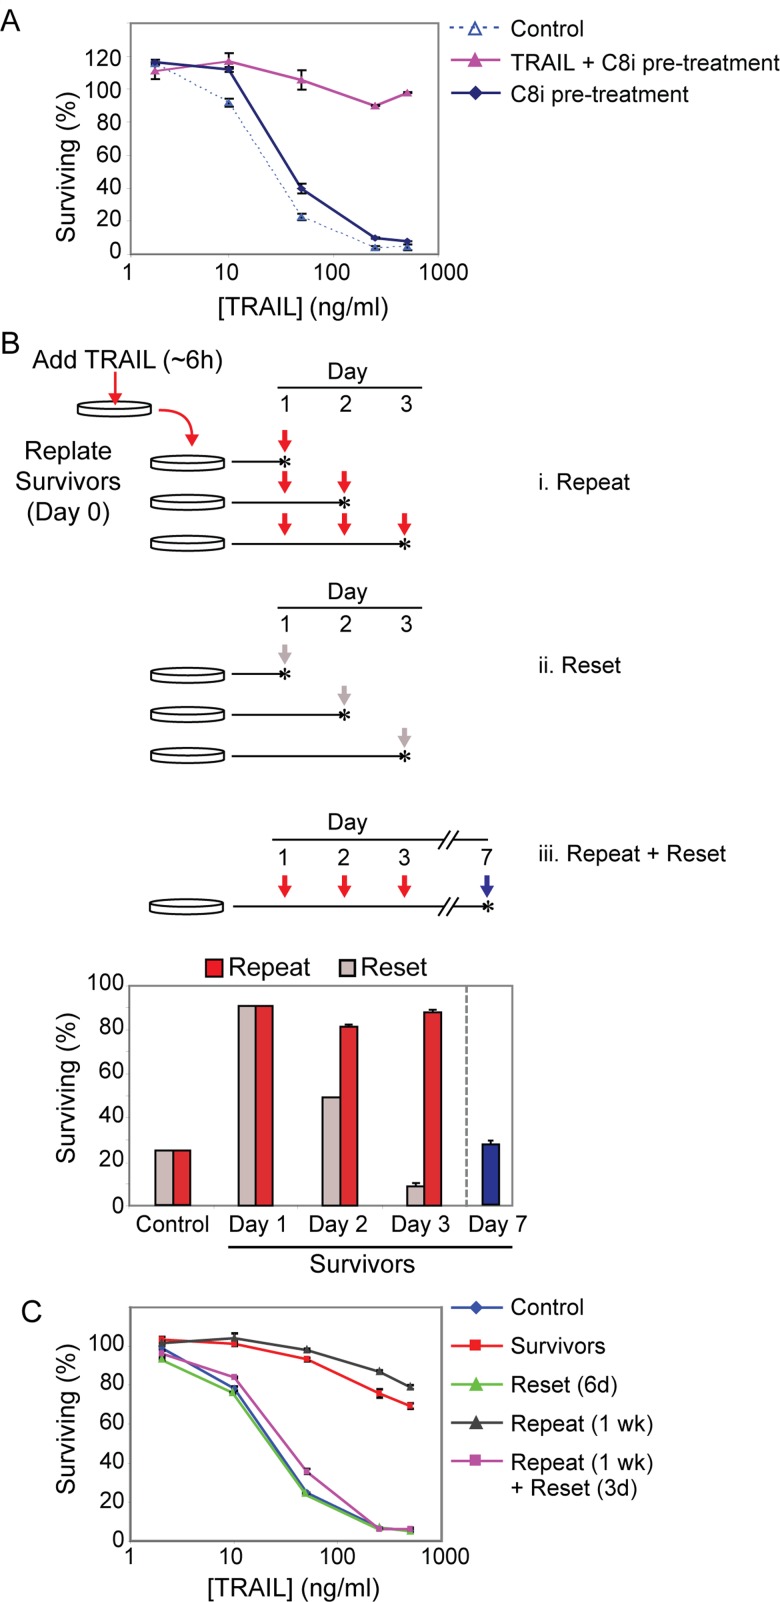
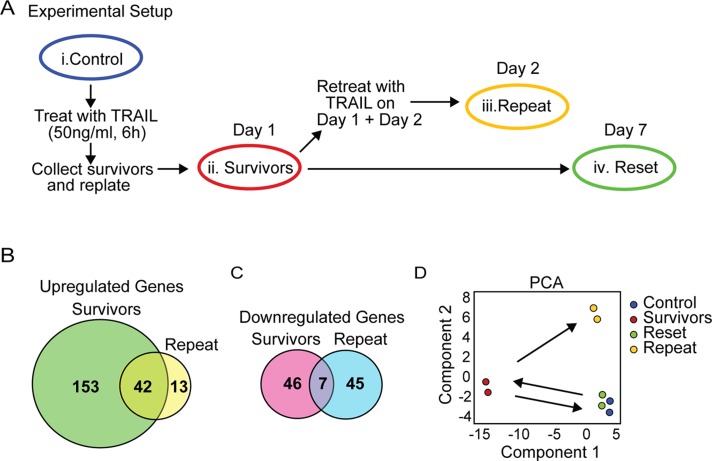
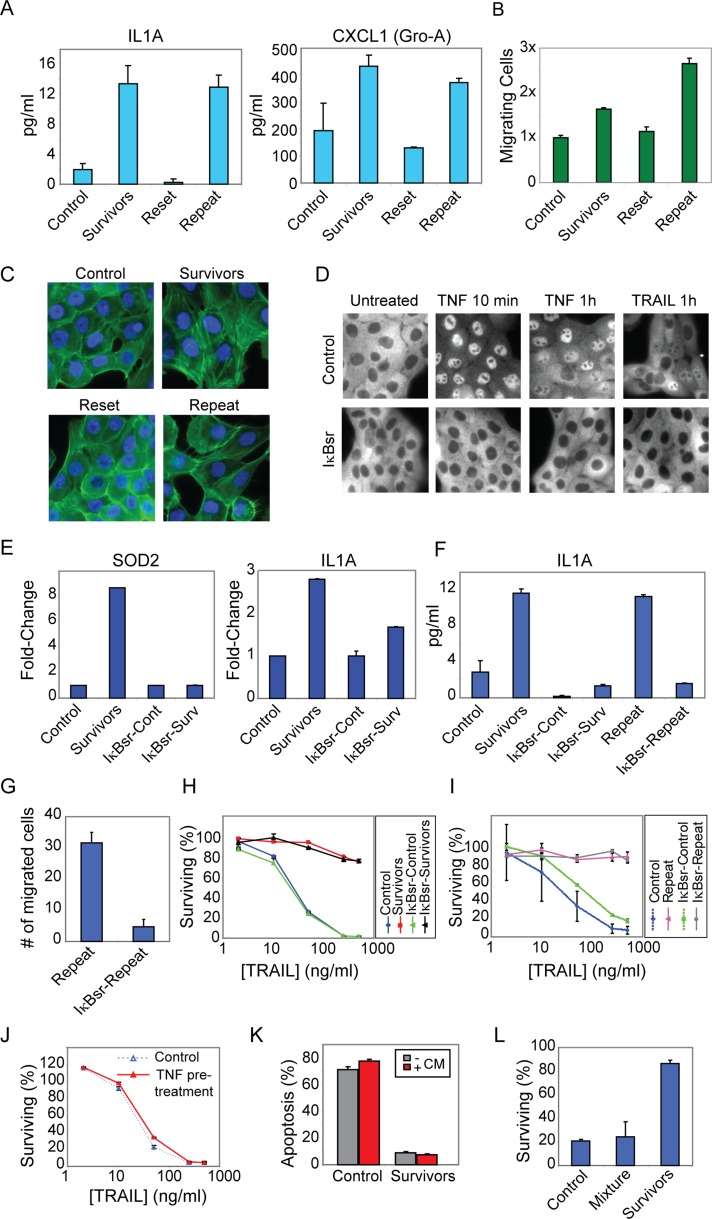
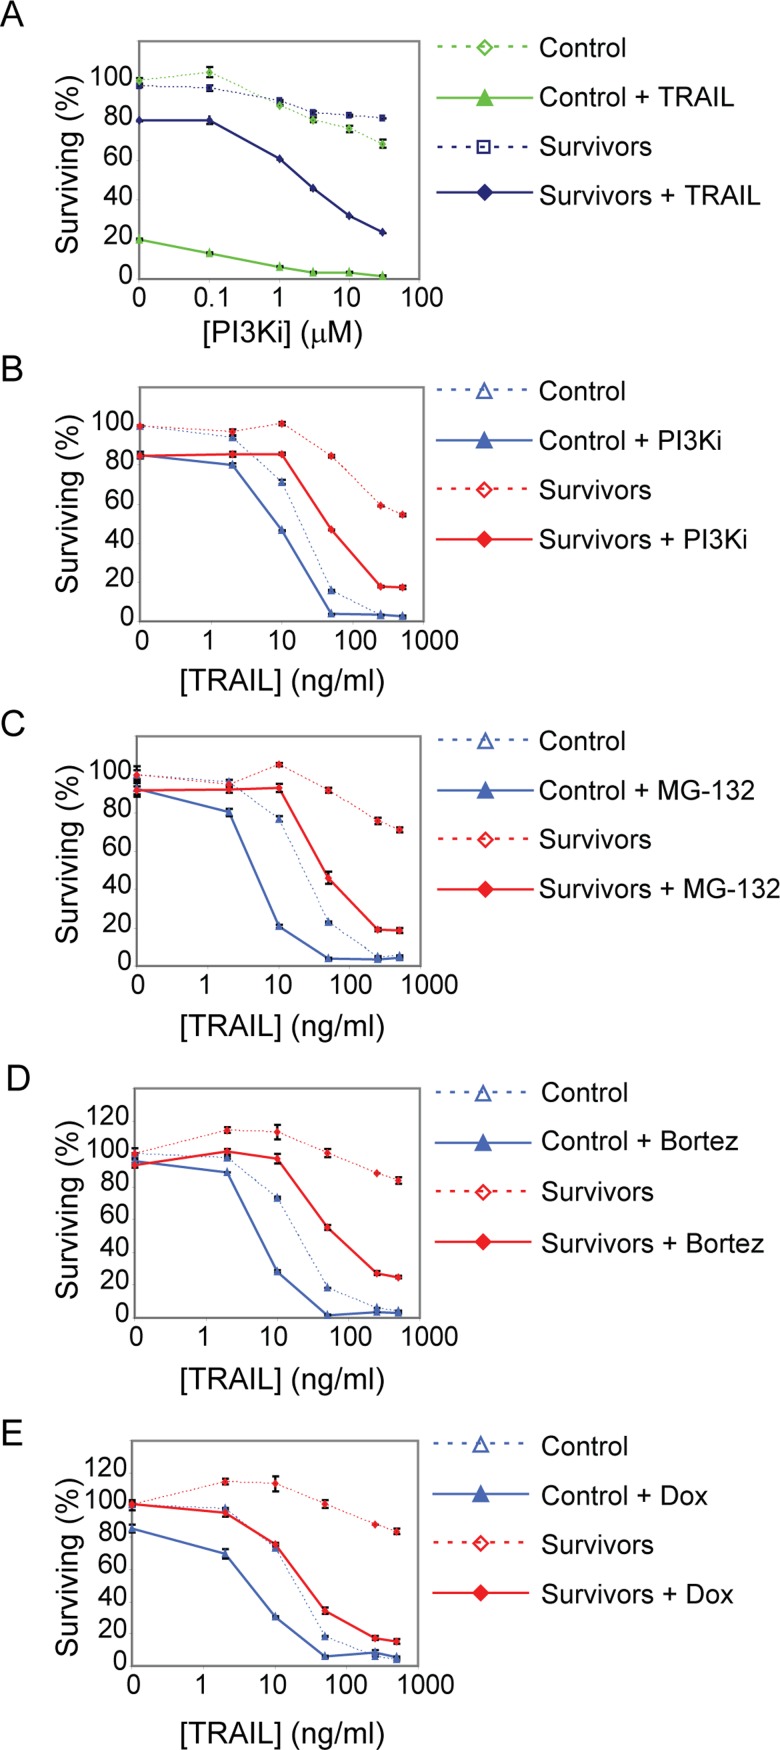
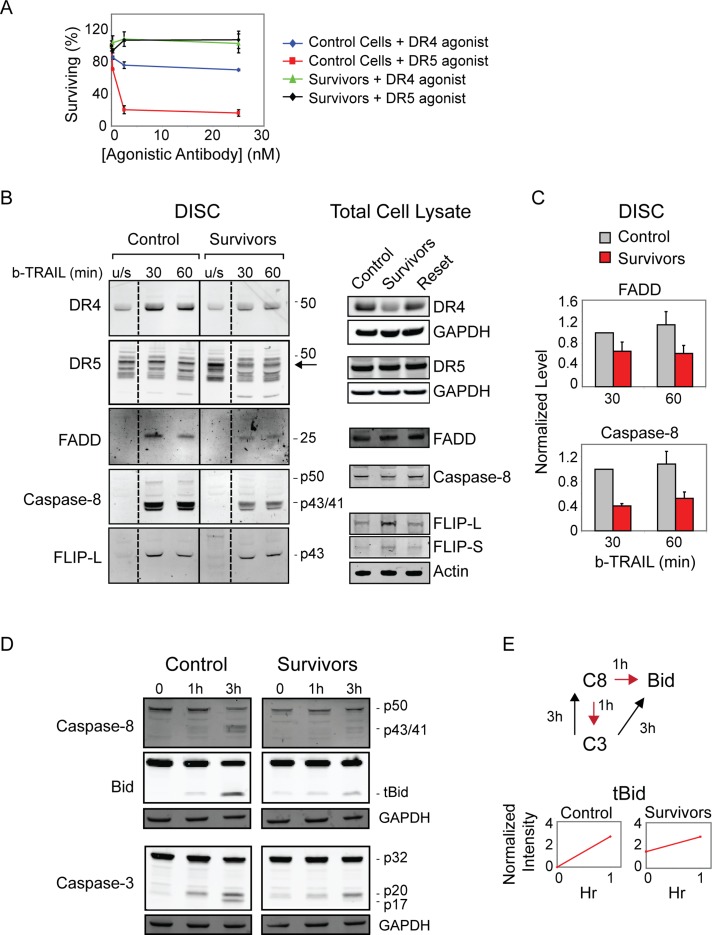
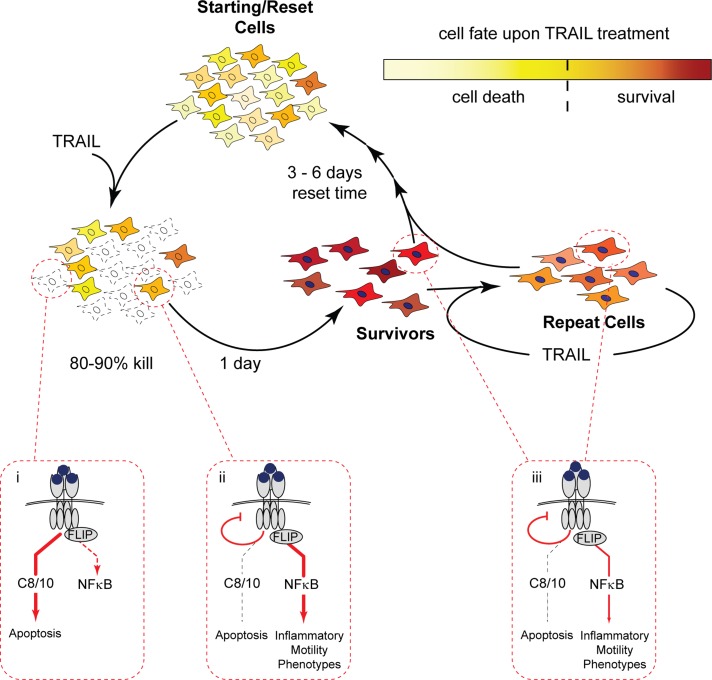
When clonal populations of human cells are exposed to apoptosis-inducing agents, some cells die and others survive. This fractional killing arises not from mutation but from preexisting, stochastic differences in the levels and activities of proteins regulating apoptosis. Here we examine the properties of cells that survive treatment with agonists of two distinct death receptors, tumor necrosis factor-related apoptosis-inducing ligand (TRAIL) and anti-FasR antibodies. We find that "survivor" cells are highly resistant to a second ligand dose applied 1 d later. Resistance is reversible, resetting after several days of culture in the absence of death ligand. "Reset" cells appear identical to drug-naive cells with respect to death ligand sensitivity and gene expression profiles. TRAIL survivors are cross-resistant to activators of FasR and vice versa and exhibit an NF-κB-dependent inflammatory phenotype. Remarkably, reversible resistance is induced in the absence of cell death when caspase inhibitors are present and can be sustained for 1 wk or more, also without cell death, by periodic ligand exposure. Thus stochastic differences in cell state can have sustained consequences for sen-sitivity to prodeath ligands and acquisition of proinflammatory phenotypes. The important role played by periodicity in TRAIL exposure for induction of opposing apoptosis and survival mechanisms has implications for the design of optimal therapeutic agents and protocols.


Figures

FIGURE 1:
FIGURE 1:
Cells that survive TRAIL-mediated apoptosis exhibit transient resistance to a second TRAIL challenge. (A) Experimental setup showing rechallenge of survivor cells on subsequent days after an initial TRAIL treatment (50 ng/ml for 6 h). (B) Flow cytometry histograms of PARP cleavage in TRAIL-treated control (naive) and survivor MCF10A cells. (C) Quantitation of B showing the fraction of cleaved PARP-negative cells (Resistance) in TRAIL-treated survivor cells following the indicated days of outgrowth, normalized to that of TRAIL-treated control cells. (D) Cell viability assay showing the percentage of surviving control, survivors (day 1), and reset (day 7) MCF10A cells after a 6-h TRAIL treatment. (E) Methylene blue staining of untreated or treated (50 ng/ml TRAIL for 6 h) control, survivor, and reset MCF10A cells; dead cells were washed off before staining. (F) Annexin V labeling of TRAIL-treated (50 ng/ml TRAIL for 6 h) control, survivor, and reset MCF10A cells; levels were normalized to TRAIL-treated survivor cells. (G) Cell viability assay of TRAIL-treated (50 ng/ml TRAIL for 7 h) control, survivor, and reset HCT116 cells (clonal population). Error bars in all plots represent the SE of triplicate samples.
FIGURE 2:
FIGURE 2:
TRAIL survivors are cross-resistant to Fas agonists and vice versa, but are sensitive to inducers of intrinsic cell death. (A–C) Cell viability assay showing the sensitivity of control cells vs. TRAIL, Anti-FasR, or staurosporine survivors (day 1) to a subsequent 6-h treatment with the indicated doses of Anti-FasR (A), staurosporine (B), or TRAIL (C). (D) Sensitivity of control vs. TRAIL-survivor cells (day 1) to an 18-h treatment with the indicated doses of doxorubicin.
FIGURE 3:
FIGURE 3:
Reversible resistance is induced even in the absence of cell death and is sustained by periodic TRAIL treatments. (A) Cell viability assay showing the sensitivity of control cells, cells pretreated for 18 h with TRAIL (50 ng/ml) + caspase-8 inhibitor (25 μM), or cells pretreated for 18 h with caspase inhibitor alone to a subsequent 6-h treatment with the indicated doses of TRAIL (after wash-off of the initial treatment). (B) Plot showing percentage of surviving (cleaved PARP-negative) cells after TRAIL (50 ng/ml for 6 h) treatment in a “repeat” experiment (i, red arrows and red bars), or in a parallel “reset” experiment (ii, gray arrows and gray bars). The plot shows the percentage of surviving control and day 1 survivor cells after TRAIL treatment for both experiments, followed by percentage of surviving cells after “retreatment” (50 ng/ml TRAIL for 6 h) on consecutive days as shown in the schematic (red scheme) or after allowing cells to “reset” for the number of days indicated before the final treatment (gray scheme). iii, Percentage of surviving (cleaved PARP-negative) cells after TRAIL (50 ng/ml for 6 h) treatment of cells allowed to recover for 4 additional days after three successive “repeat” treatments (blue arrow and blue bar). Vertical arrows in the schematic represent treatments (50 ng/ml TRAIL for 6 h), and stars represent collection times after treatment. Data are mean ± SE of triplicate samples. (C) Cell viability plot of the percentage of surviving control, survivors (day 1), reset (day 6), repeat (treated daily for 1 wk with 50 ng/ml for 6 h), and repeat + reset (treated daily for 1 wk with 50 ng/ml for 6 h and then allowed to recover for 3 d in the absence of TRAIL) MCF10A cells after a 6-h TRAIL (50 ng/ml) treatment.
FIGURE 4:
FIGURE 4:
Microarray analysis reveals distinct gene expression profiles for survivors and repeat cells, but control and reset cells cluster together. (A) Experimental setup for RNA collection from control (i), survivors (ii), repeat (iii), and reset cells (iv). (B) Venn diagram of genes significantly up-regulated in survivor and repeat cells compared with control cells. (C) Venn Diagram of genes down-regulated in survivor and repeat cells compared with control cells. (D) Principal components analysis of the gene expression data. Groups (representing duplicate samples) are plotted along the two components that account for the most variation (74.7%) in the data. The first component represents genes that differ most between control and survivor cells; the second component represents genes that differ most between control and repeat cells.
FIGURE 5:
FIGURE 5:
NF-κB mediates activation of inflammatory genes and phenotypes in survivor cells but does not mediate survival or reversible resistance. (A) ELISA of cytokine secretion (IL1A and CXCL1) in 8-h-conditioned media from MCF10A control, survivor, reset, and repeat cells. Cytokine secretion was normalized to the number of cells in each well, determined using the methylene blue cell viability assay. Error bars represent SE of replicate samples. (B) Migration assay of MCF10A cells toward EGF (100 ng/ml). Error bars indicate SE of triplicate wells; shown is a representative of three independent experiments. (C) Actin stress fiber staining of MCF10A cells (phalloidin, green; Hoechst 33342, blue). (D) NF-κB (p65) immunostaining of MCF10A ± IκBsr either untreated or treated with 50 ng/ml TNF or TRAIL for the indicated times. (E) qPCR analysis of SOD2 and IL1A gene expression in survivor cells compared with control cells and in survivor cells expressing IκBsr (IκBsr-Surv) compared with control cells expressing IκBsr (IκBsr-Cont), normalized to glyceraldehyde-3-phosphate dehydrogenase levels (mean ± SE of replicate samples). (F) ELISA of secreted IL1A in 8-h-conditioned medium from control, survivor, and repeat cells ± IκBsr expression. (G) Migration assay of repeat cells ± IκBsr expression. Number of migrated cells was counted and averaged for three independent fields. (H) Cell viability assay of control, survivors, IκBsr-Control, and IκBsr-Survivors treated with TRAIL for 6 h. (I) Cell viability assay of control, repeat, IκBsr-Control, and IκBsr-Repeat cells treated with TRAIL for 6 h. (J) Sensitivity of control MCF10A or MCF10A cells pretreated with TNF-α (100 ng/ml) for 18 h to a subsequent 6-h treatment with the indicated doses of TRAIL. Cell survival was measured using the methylene blue viability assay. (K) Percentage apoptosis in control and day 1 survivor cells either untreated (gray bars) or pretreated for 12 h with 6-h-conditioned media from another set of day 1 survivor cells (red bars) and then treated with 50 ng/ml TRAIL for 6 h. Apoptosis was assessed by staining with an antibody to cleaved PARP. (L) Fluorescently labeled control cells (control), fluorescently labeled survivor cells (survivors), or a 1:1 mixture of fluorescently labeled control cells and unlabeled survivor cells (mixture) either untreated or treated with 50 ng/ml TRAIL for 6 h. Dead cells were washed off, and fluorescence intensity was measured for each well using a fluorescence plate reader. Fraction of cells surviving was measured as a ratio of fluorescence intensity for each treated condition relative to its untreated control. The total cell density plated for each condition was held constant.
FIGURE 6:
FIGURE 6:
Codrugging sensitizes survivor cells to TRAIL but is not as effective as waiting for cells to reset. (A) Cell viability plot of control and survivor cells treated with a range of doses of the PI3K inhibitor PI-103 with or without TRAIL (50 ng/ml) for 6 h. (B) Cell viability plot of control and survivor cells treated with a range of doses of TRAIL with or without PI-103 (1 μM) for 6 h. (C) Cell viability plot of control and survivor cells treated with a range of doses of TRAIL with or without MG-132 (1 μM) for 6 h. (D) Cell viability plot of control and survivor cells treated with a range of doses of TRAIL with or without bortezomib (0.1 μM) for 6 h. (E) Cell viability plot of control and survivor cells treated with a range of doses of TRAIL with or without doxorubicin (10 μM) for 6 h.
FIGURE 7:
FIGURE 7:
Impaired DISC signaling mediates resistance of survivor cells. (A) Cell viability assay of MCF10A control and survivor cells treated for 6 h with agonist DR4 or DR5 antibodies. (B) Immunoblot of precipitated DISC proteins in control and survivor cells stimulated with biotinylated-TRAIL (500 ng/ml). For unstimulated (u/s) controls, biotinylated-TRAIL was added directly to cell lysates before pull down. The arrow marks the DR5 band corresponding to the single band observed by immunoblot analysis of total proteins (right). (C) Quantitation of DISC protein levels in B normalized to control cells at 30 min. (D) Immunoblot detection of caspase-8, Bid, and caspase-3 in control and survivor cells treated with TRAIL (50 ng/ml) for the indicated times. Dead cells were collected and lysed together with live cells. (E) Normalized intensity of tBid bands in D representing the accumulation of tBid cleaved by caspase-8 during the pre-MOMP interval (0–1 h, indicated by red arrows in schematic) in control and survivor cells. At the 3-h time point, feedback from caspase-3 amplifies the amount of cleaved substrates in dying cells (black arrows in schematic) and is therefore excluded from the quantitation.
FIGURE 8:
FIGURE 8:
TRAIL induces reversible resistance and inflammatory pathways in cells that survive an initial treatment. In this schematic, yellow shadings depict nongenetic heterogeneity in protein levels or other factors in a naive cell population. After treatment, the sensitive fraction of cells dies by apoptosis via a caspase-8/10 (C8/10) pathway, and the less sensitive fraction survives (dark yellow cells). TRAIL-induced NF-κB signaling is activated in both sensitive and resistant cells but is cut short in cells that die (see blow-ups i and ii). Within hours, survivor cells activate a transcriptional program and enter a state of induced reversible resistance whose peak lasts for ∼24 h (survivors; red cells, filled nuclei); resistance involves attenuated DISC assembly that prevents activation of sufficient C8/10 to initiate apoptosis when cells are retreated with TRAIL (blow-up ii). Resistant cells exhibit activation of a FLIP-dependent, NF-κB–mediated inflammatory response, although resistance is independent of both NF-κB and FLIP. When TRAIL is removed, survival and inflammation signals decay as cells divide, and within several days protein levels redistribute such that the new cell population is equivalent to the starting control population (reset cells). In contrast, if survivors are reexposed to TRAIL treatment during the resistance stage, resistance and inflammatory phenotypes are sustained (repeat cells). NF-κB activation is submaximal upon repeated treatment of survivor/repeat cells due to attenuated DISC assembly but is sufficient to sustain inflammatory phenotypes (blow-up iii). Repeat cells (orange shading) have an intermediate gene expression profile that has characteristics of both control and survivor cells.

Similar articles

Cited by

References

    1. Adams C, et al. Structural and functional analysis of the interaction between the agonistic monoclonal antibody Apomab and the proapoptotic receptor DR5. Cell Death Differ. 2008;15:751–761. - PubMed
    1. Albeck JG, Burke JM, Aldridge BB, Zhang M, Lauffenburger DA, Sorger PK. Quantitative analysis of pathways controlling extrinsic apoptosis in single cells. Mol Cell. 2008;30:11–25. - PMC - PubMed
    1. Aldridge BB, Gaudet S, Lauffenburger DA, Sorger PK. Lyapunov exponents and phase diagrams reveal multi-factorial control over TRAIL-induced apoptosis. Mol Syst Biol. 2011;7:553. - PMC - PubMed
    1. Ashkenazi A. Targeting the extrinsic apoptosis pathway in cancer. Cytokine Growth Factor Rev. 2008;19:325–331. - PubMed
    1. Ashkenazi A, Dixit VM. Apoptosis control by death and decoy receptors. Curr Opin Cell Biol. 1999;11:255–260. - PubMed

Publication types

MeSH terms