. 2013 May 15;27(10):1101-14.
doi: 10.1101/gad.214577.113.

Mule/Huwe1/Arf-BP1 suppresses Ras-driven tumorigenesis by preventing c-Myc/Miz1-mediated down-regulation of p21 and p15

Affiliations

Mule/Huwe1/Arf-BP1 suppresses Ras-driven tumorigenesis by preventing c-Myc/Miz1-mediated down-regulation of p21 and p15

Satoshi Inoue et al. Genes Dev. .

Abstract

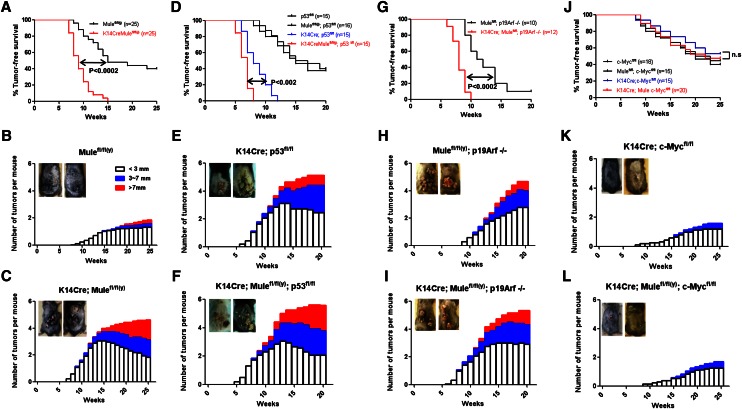
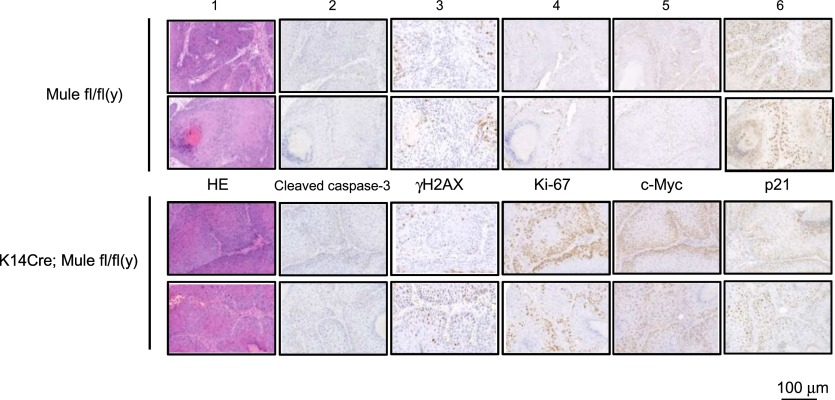
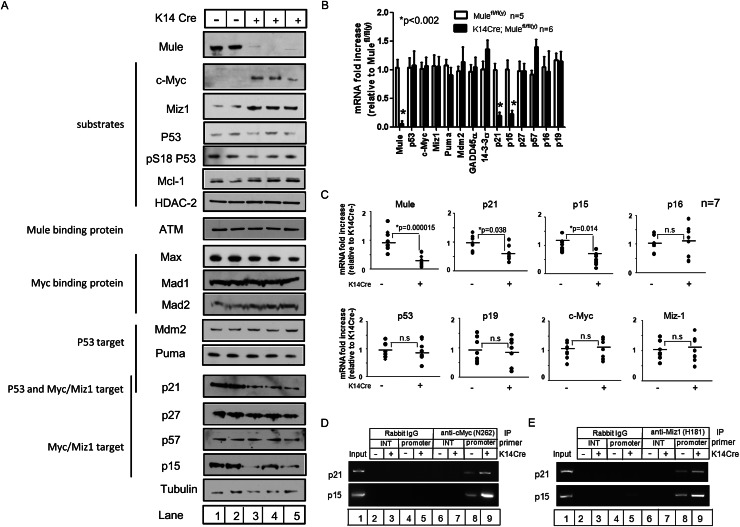
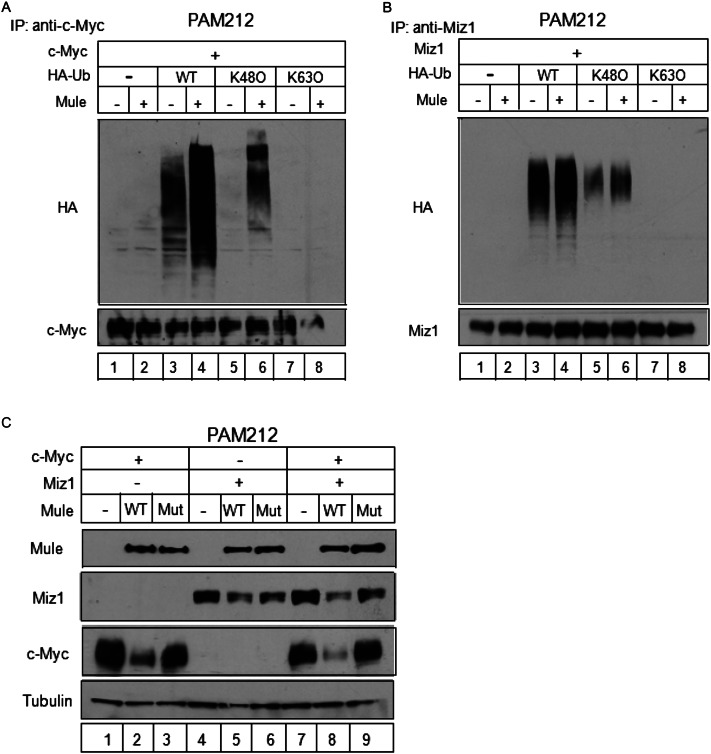
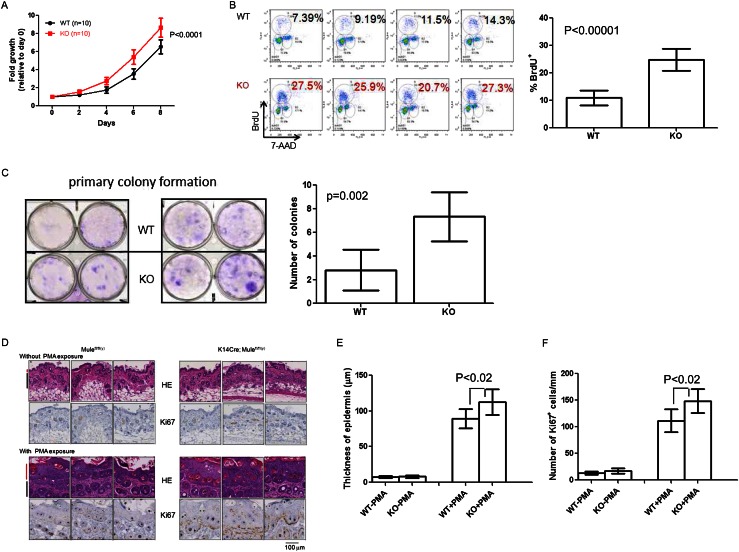
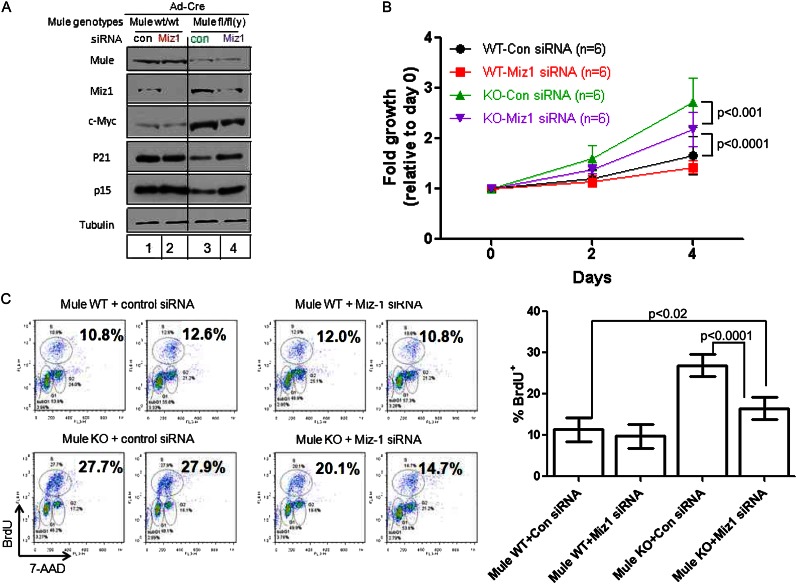
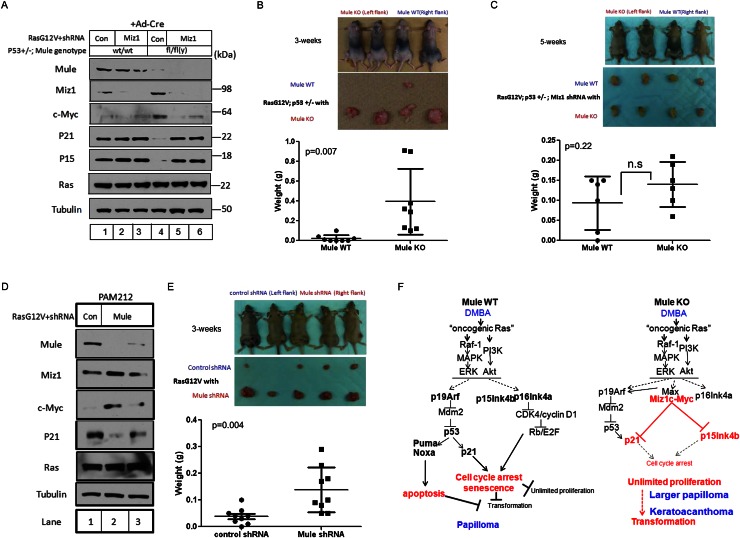
Tumorigenesis results from dysregulation of oncogenes and tumor suppressors that influence cellular proliferation, differentiation, apoptosis, and/or senescence. Many gene products involved in these processes are substrates of the E3 ubiquitin ligase Mule/Huwe1/Arf-BP1 (Mule), but whether Mule acts as an oncogene or tumor suppressor in vivo remains controversial. We generated K14Cre;Mule(flox/flox(y)) (Mule kKO) mice and subjected them to DMBA/PMA-induced skin carcinogenesis, which depends on oncogenic Ras signaling. Mule deficiency resulted in increased penetrance, number, and severity of skin tumors, which could be reversed by concomitant genetic knockout of c-Myc but not by knockout of p53 or p19Arf. Notably, in the absence of Mule, c-Myc/Miz1 transcriptional complexes accumulated, and levels of p21CDKN1A (p21) and p15INK4B (p15) were down-regulated. In vitro, Mule-deficient primary keratinocytes exhibited increased proliferation that could be reversed by Miz1 knockdown. Transfer of Mule-deficient transformed cells to nude mice resulted in enhanced tumor growth that again could be abrogated by Miz1 knockdown. Our data demonstrate in vivo that Mule suppresses Ras-mediated tumorigenesis by preventing an accumulation of c-Myc/Miz1 complexes that mediates p21 and p15 down-regulation.

Keywords: Huwe1; Miz1; Mule; Ras; c-Myc; p21.


Figures

Figure 1.
Figure 1.
Skin tumorigenesis promoted by Mule deficiency can be reversed by c-Myc deficiency. (A,D,G,J) Tumor-free survival of mice of the indicated genotypes following exposure to DMBA/PMA. P-values, log-rank test. (n.s.) Not significant. (B,C,E,F,H,I,K,L) Numbers of tumors that were small (∼3 mm), medium (3∼7 mm) or large (>7 mm) that developed on the dorsal skin of the mice in A, D, G, and J. (Insets) Representative examples of dorsal skin tumors.
Figure 2.
Figure 2.
Skin tumors in Mule-deficient mice show enhanced cellular proliferation, increased c-Myc protein, and decreased p21 protein. Representative tumor samples from two Mulefl/fl(y) and two K14Cre;Mulefl/fl(y) (Mule kKO) mice were subjected to hematoxylin–eosin (HE) staining (panel 1) as well as IHC analysis to detect the indicated proteins (panels 2–6).
Figure 3.
Figure 3.
Mule deficiency increases c-Myc and Miz1 and decreases p21 and p15. (A) Immunoblotting to detect the indicated proteins in lysates of primary keratinocytes from Mulefl/fl(y) (lanes 1,2) and K14Cre;Mulefl/fl(y) (lanes 3–5) mice. Tubulin was used as a loading control. (B) Quantitative RT–PCR determination of the indicated mRNAs in primary keratinocytes from Mulefl/fl(y) and K14Cre;Mulefl/fl(y) mice. Values were normalized to 18S rRNA. Data are the mean fold increase ± SD relative to levels in control keratinocytes. P-values are from unpaired Student’s t-test. (C) Quantitative RT–PCR of the indicated mRNAs in skin tumors from Mulefl/fl(y) (−) and K14Cre;Mulefl/fl(y) (+) mice, determined as for B. Data points represent tumor samples from individual mice (n = 7 per group). P-values are from unpaired Student’s t-test. (D,E) ChIP assays of primary keratinocytes from Mulefl/fl(y) (lanes 2,4,6,8) and K14Cre;Mulefl/fl(y) (lanes 3,5,7,9) mice. Lysates were immunoprecipitated (IP) with rabbit anti-IgG (control), rabbit anti-c-Myc (N262) Ab (D), or rabbit anti-Miz1 (H190) Ab (E). The coimmunoprecipitated promoter regions of the indicated genes were amplified by PCR. (Input) Positive control (lane 1); (INT) internal control.
Figure 4.
Figure 4.
Mule controls the stability of c-Myc and Miz1 by regulating their ubiquitin-mediated proteasomal degradation. (A,B) In vivo ubiquitination of c-Myc and Miz1 by Mule. PAM212 cells were cotransfected with vectors expressing Mule and c-Myc (A) or Miz1 (B), plus wild-type (WT) HA-ubiquitin (lanes 3,4), or HA-ubiquitin in which all lysine mutated except for K48 (K48O; lanes 5,6) or K63 (K63O; lanes 7,8). After MG132 exposure for 2 h, cell lysates were immunoprecipitated (IP) using rabbit anti-c-Myc (N262) Ab (A) or rabbit anti-Miz1 (H-190) Ab (B). The indicated proteins in the immunoprecipitates were identified by immunoblotting. (C) PAM212 cells were cotransfected with vectors expressing c-Myc (lanes 1–3), Miz1 (lanes 4–6), or both (lanes 7–9), plus wild-type (WT) Mule (lanes 2,5,8) or the enzymatically inactive C4341A Mule mutant (Mut; lanes 3,6,9). The indicated proteins were identified by immunoblotting.
Figure 5.
Figure 5.
Mule deficiency increases keratinocyte proliferation. (A) Primary keratinocytes from Mulewt/wt (WT) and Mulefl/fl(y) (KO) mice (n = 10 per group) were exposed to Ad-Cre for 24 h. Cell numbers were counted on days 2, 4, 6, and 8 post-exposure. Data are the mean ± SD and are expressed as fold increase relative to cell numbers at day 0. P-value is from two-way ANOVA. (B) Flow cytometric analysis of BrdU incorporation by primary keratinocytes from the mice in A. (Left) Representative histograms for four mice per group. Numbers are percentage of BrdU+ cells. (Right) Statistical analysis of percentage of BrdU+ cells for all mice in A. Data are the mean ± SD (n = 10 per group). P-value is from unpaired Student’s t-test. (C) Colony formation assay of Mulefl/fl(y) (WT) and K14Cre;Mulefl/fl(y) (KO) keratinocytes that were seeded in six-well plates (2 × 10⁴ per well) and cultured for 2 wk. Cells were stained with 0.5% crystal violet. (Left) Representative staining. (Right) Quantitation of number of colonies per well. Data are the mean ± SD (n = 6 per group). P-value is from unpaired Student’s t-test. (D) HE staining (top) and Ki67 staining (bottom) of dorsal skin from three Mulefl/fl(y) and three K14Cre;Mulefl/fl(y) mice that were either left untreated or treated with PMA every day for 5 d, as indicated. (Red line) Epidermis; (black line) dermis. (E,F) Quantitation of thickness of basal epidermis (E) and number of Ki67+ cells per millimeter (F) in dorsal skin samples from the mice in D. Data were acquired from 40 different images derived from four mice per group. Data are the mean ± SD. P-values are from unpaired Student’s t-test.
Figure 6.
Figure 6.
Miz1 knockdown reverses the enhanced proliferation associated with Mule deficiency. (A) Immunoblotting to detect the indicated proteins in Ad-Cre-infected Mulewt/wt and Mulefl/fl(y) primary keratinocytes transfected with control siRNA (Con) or Miz1 siRNA (Miz1). (B) The proliferation of the siRNA-expressing keratinocytes in A was analyzed by counting cell numbers at 2 and 4 d post-seeding. Data are the mean ± SD of six cultures per group. P-values are from two-way ANOVA. (C) The proliferation of the siRNA-transfected keratinocytes in A was analyzed by BrdU incorporation as for Figure 5B. (Left) Representative flow cytometric histograms for two cultures per group. Numbers are percentage of BrdU+ cells. (Right) Statistical analysis of percentage of BrdU+ cells for all cultures in A. Data are the mean ± SD of six cultures per group. P-values are from unpaired Student’s t-test.
Figure 7.
Figure 7.
Mule deficiency promotes Ras-induced tumorigenesis in vivo through a mechanism involving Miz1. (A) Immunoblotting to detect the indicated proteins in lysates of primary MEFs from Mulewt/wt;p53+/− (lanes 1–3) or Mulefl/fl(y);p53+/− (lanes 4–6) mice that were exposed to Ad-Cre for 24 h, followed by retroviral infection with pMX-RasG12V-IRES-Puror-control shRNA (lanes 1,4) or pMX-RasG12V-IRES-Puror-Miz1 shRNA (lanes 2,3,5,6). (B) Transformed control or Mule-deficient MEFs from the cultures in A were subcutaneously injected (1 × 10⁶ cells) into the right (Mule WT) (A, lane 1) or left (Mule KO) (A, lane 4) flanks of athymic nude mice. (Top) Representative photos of four mice per group are shown at 3 wk post-injection. (Middle) Gross views of representative tumors isolated from the mice in the top panel. (Bottom) Weights of tumors of injected mice at 3 wk post-injection. Data points are tumor weight per individual mouse. (Horizontal line) Mean weight ± SD for the group (n = 8). P-value is from unpaired Student’s t-test. (C) Transformed control or Mule-deficient MEFs expressing Miz1 shRNA (from the cultures in A) were subcutaneously injected (1 × 10⁶ cells) into the right (Mule WT-Miz1 shRNA) (A, lane 2) or left (Mule KO-Miz1 shRNA) (A, lane 5) flanks of athymic nude mice. (Top) Representative photos of four mice per group at 5 wk post-injection. (Middle) Gross views of representative tumors isolated from the mice in the top panel. (Bottom) Weights of tumors of injected mice at 5 wk post-injection. Data points are tumor weight per individual mouse. (Horizontal line) Mean weight ± SD for the group (n = 6). P-value is from unpaired Student’s t-test. (D) Immunoblotting to detect the indicated proteins in PAM212 cells infected with pMX-RasG12V-IRES-puror-control shRNA (Con) or pMX-RasG12V-IRES-puror-Mule shRNA (Mule). (E) The control or Mule-depleted PAM212 cells in D were subcutaneously injected (1 × 10⁶ cells) into the left (control shRNA) (D, lane 1) or right (Mule shRNA) (D, lane 2) flanks of athymic nude mice. (Top) Representative photos of five control and five Mule-depleted mice at 3 wk post-injection. (Middle) Gross views of representative tumors isolated from the mice in the top panel. (Bottom) Tumors of injected mice at 3 wk post-injection. Data points are tumor weight per individual mouse. (Horizontal line) Mean weight ± SD for the group (n = 9). P-value is from unpaired Student’s t-test. (F) Proposed model for the role of Mule in cancer. (Left) In wild-type cells exposed to DMBA/PMA, oncogenic Ras signaling induces cell cycle arrest, senescence, and/or apoptosis through activation of the p19Arf–p53–p21 and p16/p15–Retinoblastoma (Rb) tumor suppressor pathways. Unlimited cellular proliferation and transformation are blocked. Thus, wild-type mice exposed to DMBA/PMA develop only small benign tumors such as papillomas. (Right) In Mule-deficient cells exposed to DMBA/PMA, c-Myc/Miz1 complexes that have accumulated due to the lack of Mule prevent p21 and p15 induction by oncogenic Ras signaling. This down-regulation of p21 and p15 weakens the cell cycle arrest/senescence/apoptosis barrier against unlimited proliferation and transformation. Thus, Mule-deficient mice exposed to DMBA/PMA develop larger papillomas and KA.

Similar articles

Cited by

References

    1. Adhikary S, Peukert K, Karsunky H, Beuger V, Lutz W, Elsasser HP, Moroy T, Eilers M 2003. Miz1 is required for early embryonic development during gastrulation. Mol Cell Biol 23: 7648–7657 - PMC - PubMed
    1. Adhikary S, Marinoni F, Hock A, Hulleman E, Popov N, Beier R, Bernard S, Quarto M, Capra M, Goettig S, et al. 2005. The ubiquitin ligase HectH9 regulates transcriptional activation by Myc and is essential for tumor cell proliferation. Cell 123: 409–421 - PubMed
    1. Basu S, Liu Q, Qiu Y, Dong F 2009. Gfi-1 represses CDKN2B encoding p15INK4B through interaction with Miz-1. Proc Natl Acad Sci 106: 1433–1438 - PMC - PubMed
    1. Bos JL 1989. ras oncogenes in human cancer: A review. Cancer Res 49: 4682–4689 - PubMed
    1. Bringold F, Serrano M 2000. Tumor suppressors and oncogenes in cellular senescence. Exp Gerontol 35: 317–329 - PubMed

Publication types

MeSH terms

Substances