. 2013 May 15;27(10):1146-58.
doi: 10.1101/gad.215459.113.

Extensive polymerase pausing during Drosophila axis patterning enables high-level and pliable transcription

Affiliations

Extensive polymerase pausing during Drosophila axis patterning enables high-level and pliable transcription

Abbie Saunders et al. Genes Dev. .

Abstract

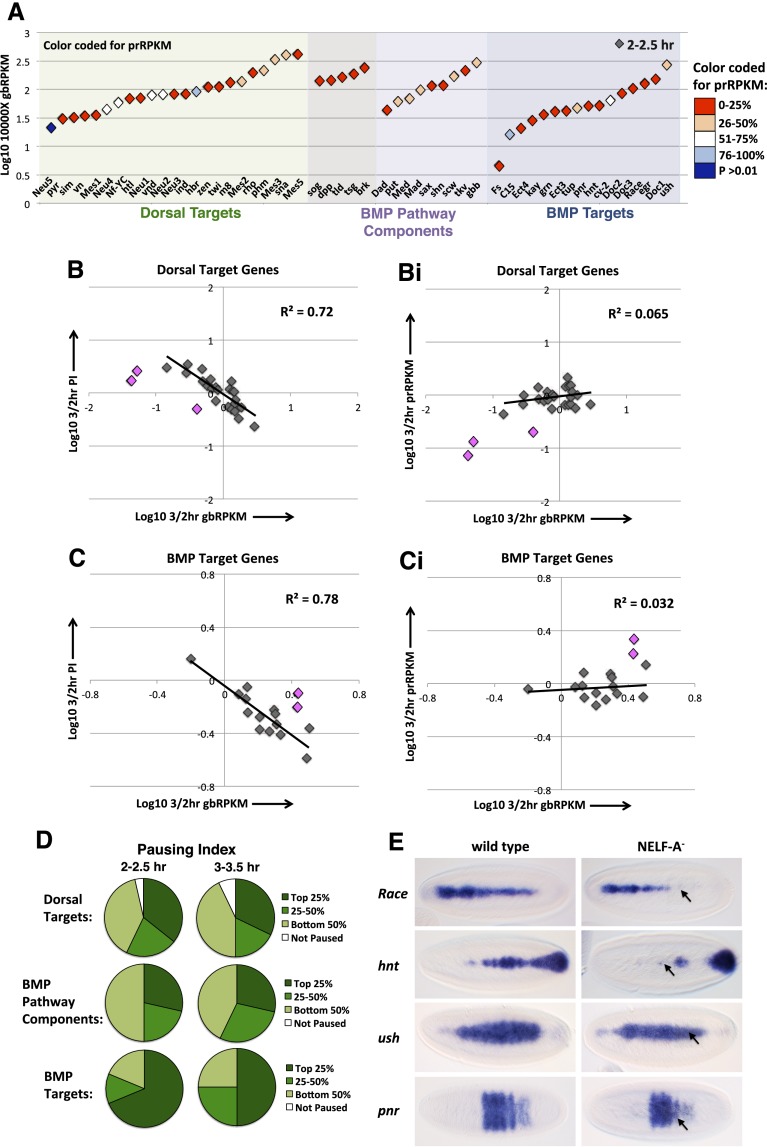
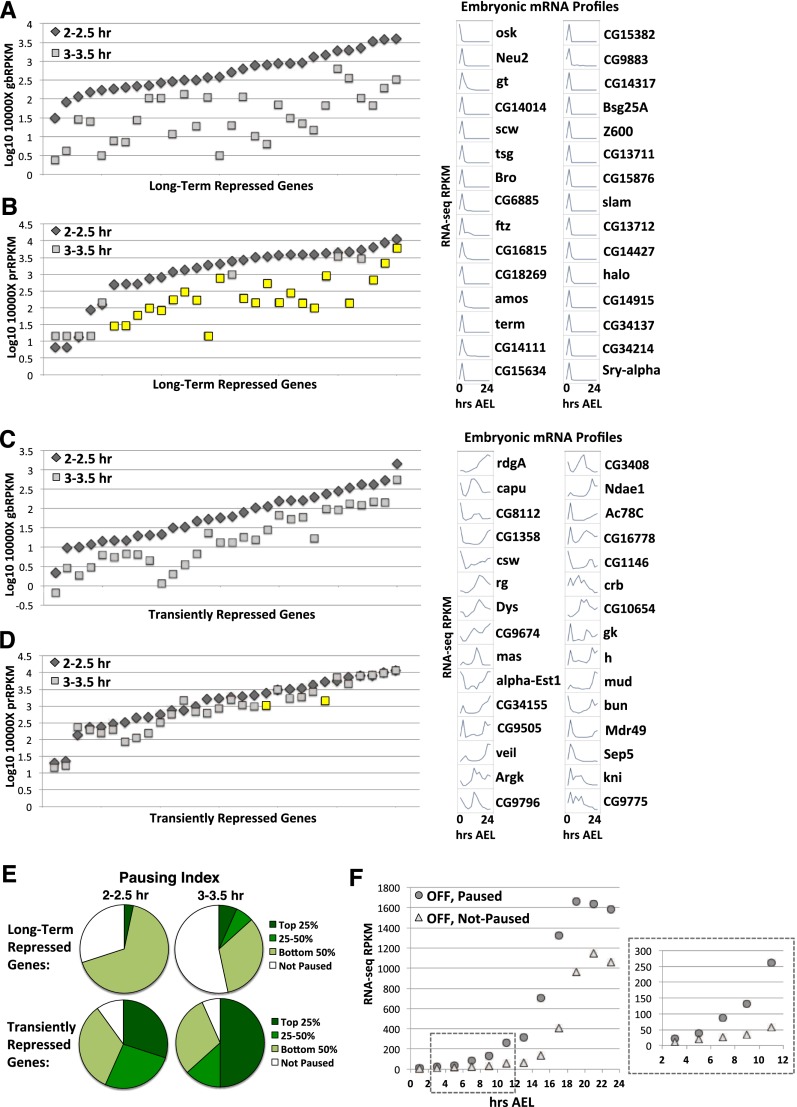
Cascades of zygotic gene expression pattern the anterior-posterior (AP) and dorsal-ventral (DV) axes of the early Drosophila embryo. Here, we used the global run-on sequencing assay (GRO-seq) to map the genome-wide RNA polymerase distribution during early Drosophila embryogenesis, thus providing insights into how genes are regulated. We identify widespread promoter-proximal pausing yet show that the presence of paused polymerase does not necessarily equate to direct regulation through pause release to productive elongation. Our data reveal that a subset of early Zelda-activated genes is regulated at the level of polymerase recruitment, whereas other Zelda target and axis patterning genes are predominantly regulated through pause release. In contrast to other signaling pathways, we found that bone morphogenetic protein (BMP) target genes are collectively more highly paused than BMP pathway components and show that BMP target gene expression requires the pause-inducing negative elongation factor (NELF) complex. Our data also suggest that polymerase pausing allows plasticity in gene activation throughout embryogenesis, as transiently repressed and transcriptionally silenced genes maintain and lose promoter polymerases, respectively. Finally, we provide evidence that the major effect of pausing is on the levels, rather than timing, of transcription. These data are discussed in terms of the efficiency of transcriptional activation required across cell populations during developmental time constraints.

Keywords: BMP; Dpp signaling pathway; Drosophila embryo; GRO-seq; axis patterning; promoter-proximal pausing; zygotic transcription.


Figures

Figure 1.
Figure 1.
Transcriptional activity within the early embryo. (A) Chart showing the distribution of gbRPKMs across all genes in the Drosophila genome (see the Materials and Methods). (B) Pie chart displaying proportion of genes that are transcriptionally active (have a gbActPval of <0.01) or inactive (have a gbActPval of >0.01) at 2–2.5 h AEL. The number of active and inactive genes is displayed. (C) Chart showing the distribution of PIs across all genes in the Drosophila genome (see the Materials and Methods). (D) Pie chart displaying proportion of genes that are paused (have a pausing P-value of <0.01) or not paused (have a pausing P-value of >0.01) at 2–2.5 h AEL. (E) Chart showing the paused and not paused genes in D also separated depending on whether the genes are active or inactive. (F) UCSC genome browser images of GRO-seq data for an example of each class of gene at 2–2.5 h, with the percentage of genes in each category shown.
Figure 2.
Figure 2.
Transcription dynamics of the segmentation genes. (A) Graph shows the gbRPKMs of the individual segmentation genes at 2–2.5 h. The points are color-coded for the 2- to 2.5-h prRPKMs; color denotes whether a gene is not paused (based on a pausing P-value of >0.01) or paused with a prRPKM within the top 0%–25%, 26%–50%, 51%–75%, or 76%–100% of paused genes. (B) Relative PIs of the gap, pair-rule, and segment polarity genes. Genes are categorized as not paused or paused with a PI within the top 25%, 25%–50%, or bottom 50% of all paused genes at 2–2.5 h or 3–3.5 h. See also Supplemental Table S4. (C,Ci) Graphs show the change in gbRPKM (C) versus the change in PI or prRPKM (Ci) from 2–2.5 h to 3–3.5 h for the gap, pair-rule, and segment polarity genes. The point highlighted in pink corresponds to ftz, which exhibits characteristics of regulation by polymerase recruitment and is excluded from the trend line.
Figure 3.
Figure 3.
Transcription dynamics of the DV patterning genes. (A) Graph shows the gbRPKMs of the DV patterning genes at 2–2.5 h. The points are color coded for the 2- to 2.5-h prRPKMs; color denotes whether a gene is not paused (P > 0.01) or paused with a prRPKM within the top 0%–25%, 26%–50%, 51%–75%, or 76%–100% of paused genes. The five genes shaded in gray are both Dorsal targets and BMP pathway components. (B,Bi) Graphs show the change in gbRPKM (B) versus the change in PI or prRPKM (Bi) from 2–2.5 h to 3–3.5 h for the Dorsal target genes. Neu2, tsg, and zen (highlighted in pink) exhibit characteristics of regulation by polymerase recruitment and are excluded from the trend line. The gbRPKMs and prRPKMs of Mes1 and Neu1 do not change and are therefore absent from the chart. (C,Ci) As in B and Bi for the BMP target genes. Doc2 and C15 (highlighted in pink) exhibit characteristics of regulation by polymerase recruitment and are excluded from the trend line. (D) Pie charts show the proportion of DV patterning genes with PIs within the top 25%, or 25%–50% or bottom 50% of all paused genes at 2–2.5 h or 3–3.5 h. See also Supplemental Table S5. (E) RNA in situ hybridization for the Race, hnt, ush, and pnr mRNAs, activated in response to BMP signaling, in wild-type or NELF-A maternal and zygotic null embryos. Embryos are dorsal views with anterior to the left.
Figure 4.
Figure 4.
Regulation of Zld target genes. (A) Graph shows gbRPKMs at 2–2.5 h for Zld target genes (Liang et al. 2008); the points are color-coded for prRPKM at 2–2.5 h, as detailed in the legend. Gene list is shown in Supplemental Figure S6E. (B,C) Graphs show the changes in gbRPKM versus PI (B,C) or prRPKM (Bi,Ci) from 2–2.5 h to 3–3.5 h for Zld genes regulated by pause release (B) or recruitment (C). Genes within these categories are listed in Supplemental Figure S6E. (D) Pie charts show proportion of Zld target genes with PIs within the top 25% or 25%–50% or bottom 50% of all paused genes at 2–2.5 h or 3–3.5 h. See also Supplemental Table S8.
Figure 5.
Figure 5.
Long-term consequences of pausing. (A,B) Graphs show the gbRPKMs (A) or prRPKMs (B) of long-term repressed genes at 2–2.5 h or 3–3.5 h. Genes are ordered by the 2- to 2.5-h gbRPKM (A) or prRPKM (B), low–high in both cases; therefore, the gene order differs in A and B. All gbRPKM changes are statistically significant (DESeq adjusted P-value < 0.2); statistically significant prRPKM changes are highlighted in yellow. The minicharts on the right display mRNA levels for each of the 30 genes during embryogenesis, derived from modENCODE data. Gene orders are listed in Supplemental Figure S7A. (C,D) As in A and B, but the data shown are for transiently repressed genes. (E) Pie charts show the proportion of long-term or transiently repressed genes with PIs within the top 25% or 25%–50% or bottom 50% of all paused genes at 2–2.5h or 3–3.5 h. (F) Graph shows the average RNA-seq RPKM for class III versus class IV zygotic genes throughout embryogenesis.

Comment in

References

    1. Adelman K, Lis JT 2012. Promoter-proximal pausing of RNA polymerase II: Emerging roles in metazoans. Nat Rev Genet 13: 720–731 - PMC - PubMed
    1. Anders S, Huber W 2010. Differential expression analysis for sequence count data. Genome Biol 11: R106. - PMC - PubMed
    1. Arbeitman MN, Furlong EE, Imam F, Johnson E, Null BH, Baker BS, Krasnow MA, Scott MP, Davis RW, White KP 2002. Gene expression during the life cycle of Drosophila melanogaster. Science 297: 2270–2275 - PubMed
    1. Arora K, Levine MS, O'Connor MB 1994. The screw gene encodes a ubiquitously expressed member of the TGF-β family required for specification of dorsal cell fates in the Drosophila embryo. Genes Dev 8: 2588–2601 - PubMed
    1. Bentley DL, Groudine M 1986. A block to elongation is largely responsible for decreased transcription of c-myc in differentiated HL60 cells. Nature 321: 702–706 - PubMed

Publication types

MeSH terms