. 2013 May 22;33(21):8937-50.
doi: 10.1523/JNEUROSCI.4288-12.2013.

Balance of calcineurin Aα and CDK5 activities sets release probability at nerve terminals

Affiliations

Balance of calcineurin Aα and CDK5 activities sets release probability at nerve terminals

Sung Hyun Kim et al. J Neurosci. .

Abstract

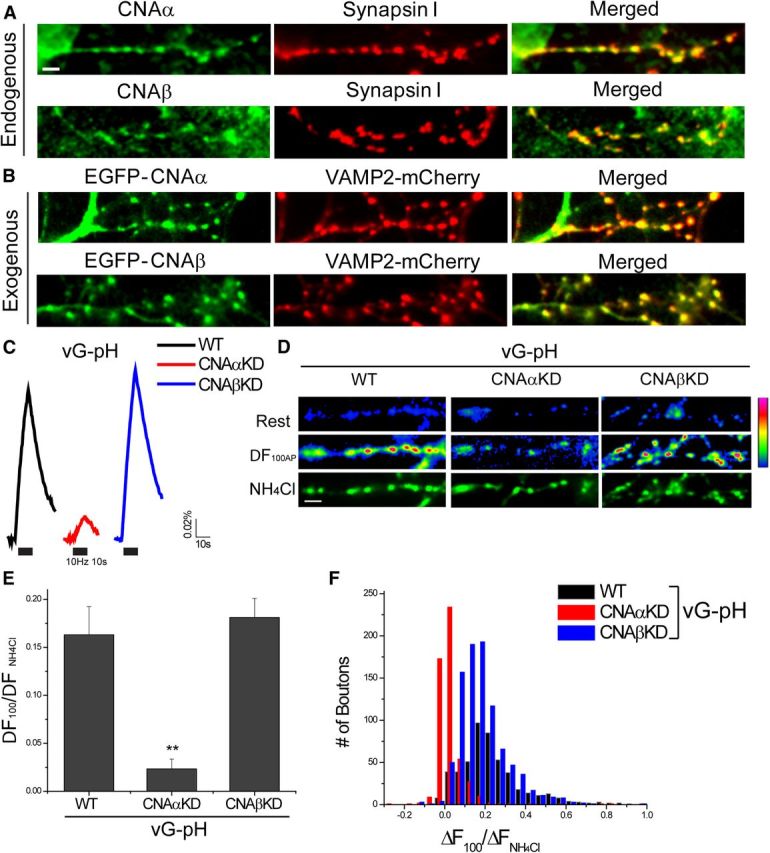
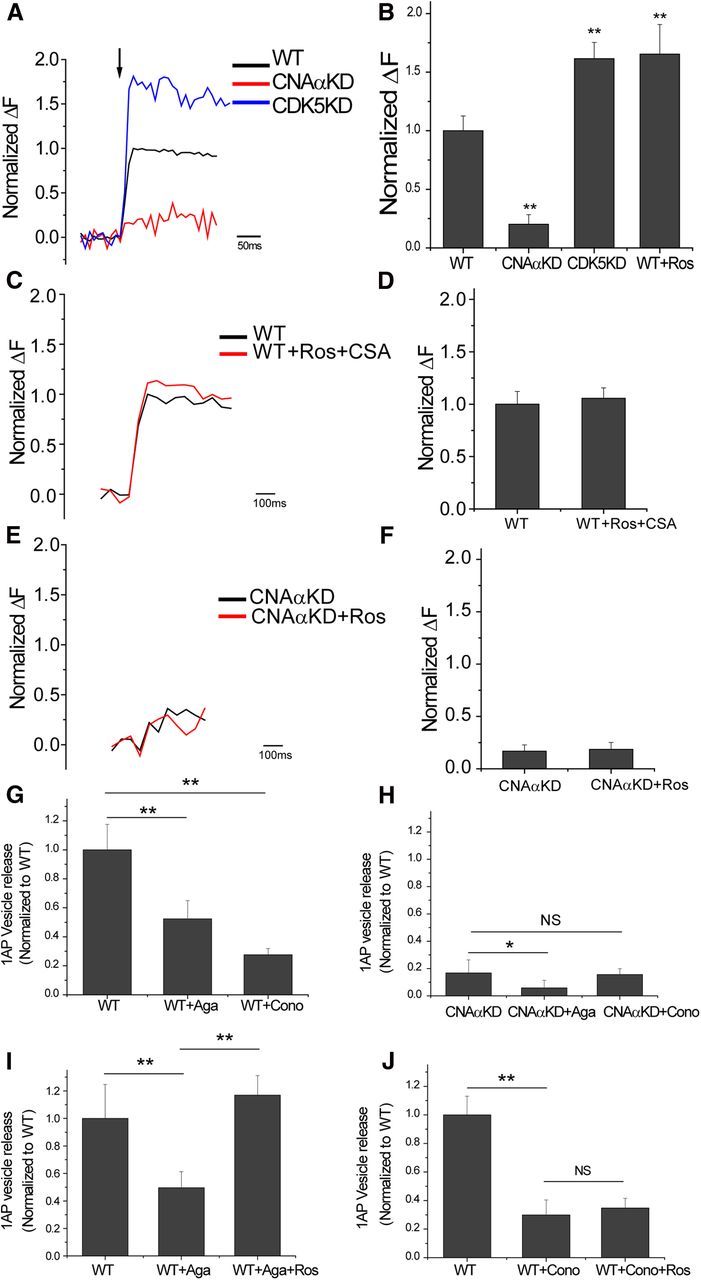
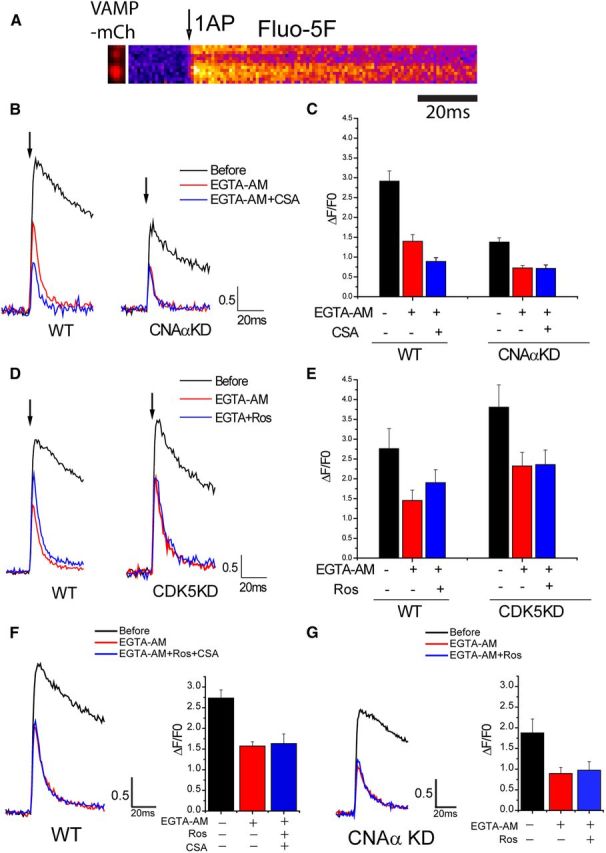
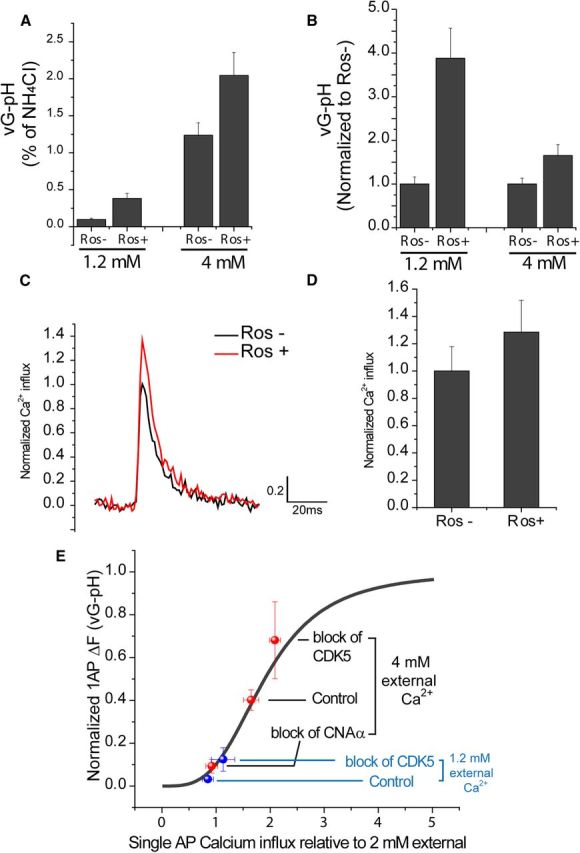
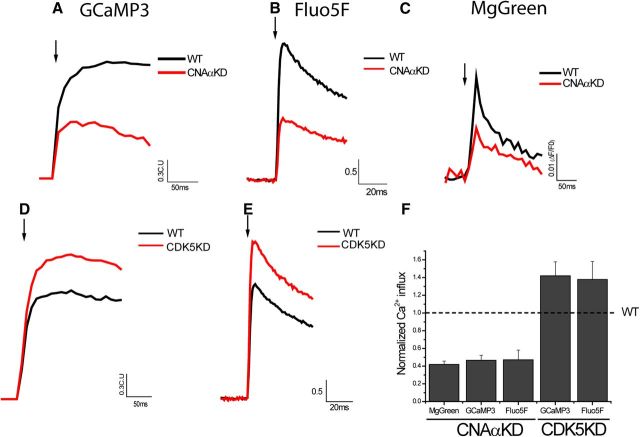
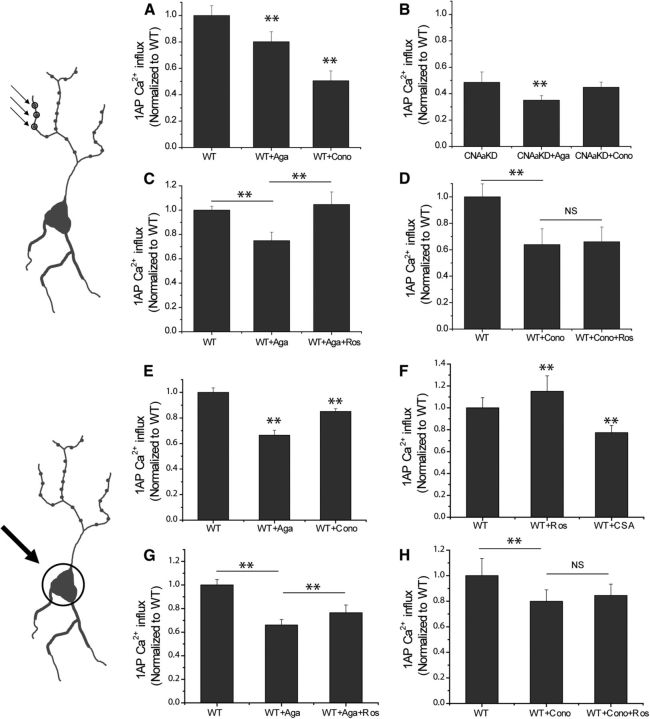
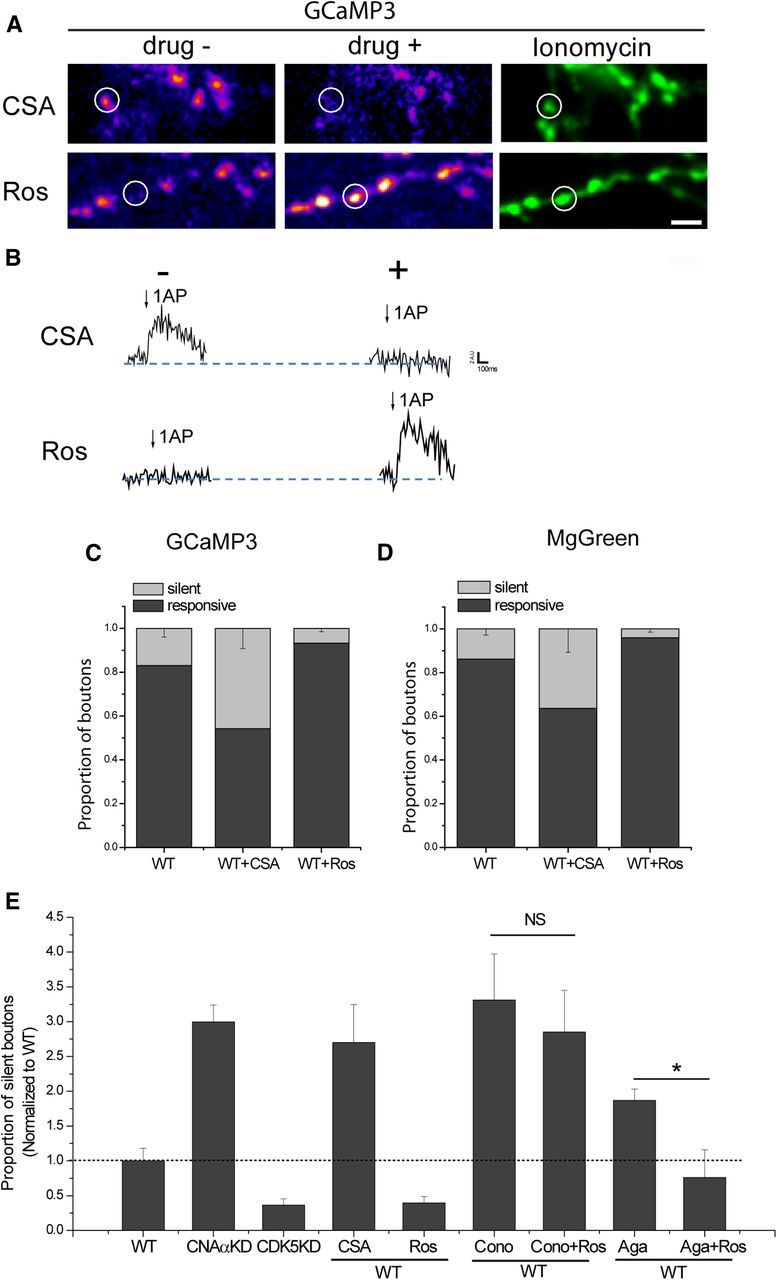
The control of neurotransmitter release at nerve terminals is of profound importance for neurological function and provides a powerful control system in neural networks. We show that the balance of enzymatic activities of the α isoform of the phosphatase calcineurin (CNAα) and the kinase cyclin-dependent kinase 5 (CDK5) has a dramatic influence over single action potential (AP)-driven exocytosis at nerve terminals. Acute or chronic loss of these enzymatic activities results in a sevenfold impact on single AP-driven exocytosis. We demonstrate that this control is mediated almost entirely through Cav2.2 (N-type) voltage-gated calcium channels as blocking these channels with a peptide toxin eliminates modulation by these enzymes. We found that a fraction of nerve terminals are kept in a presynaptically silent state with no measurable Ca(2+) influx driven by single AP stimuli attributable to the balance of CNAα and CDK5 activities because blockade of either CNAα or CDK5 activity changes the proportion of presynaptically silent nerve terminals. Thus, CNAα and CDK5 enzymatic activities are key determinants of release probability.


Figures

Figure 1.
Figure 1.
Ablation of CNAα not CNAβ in hippocampal synapses impairs synaptic AP stimulate exocytosis. A, Representative images of CNAα, CNAβ, and synapsin I immunostaining. Mature (14–18 d in vitro) neurons were fixed and costained with anti-CNAα antibody (green) and anti-synapsin I (red) (top) or anti-CNAβ antibody (green) and anti-synapsin I (red) (bottom) and subsequently applied by appropriate secondary antibodies. Scale bar, 5 μm. B, EGFP–CNAα (top) or EGFP–CNAβ (bottom) with the presynaptic terminal marker (VAMP2–mCh) transfected into neurons. C, Ensemble average traces of vG–pH responses to 100 AP stimulation at 10 Hz from WT (black), CNAα (red), and CNAβ (blue) depleted neurons. Intensities of vG–pH were normalized to the peak of a subsequent NH4Cl response (total vesicle pool). D, Representative field of vG–pH fluorescence images at rest, the difference image for 100 AP stimulation (ΔF100AP), and during NH4Cl application in WT, CNAαKD, or CNAβKD neurons. Scale bar, 5 μm. Average 100 AP (ΔF100AP) response is significantly lower in CNAαKD but is unchanged in CNAβKD neurons. E, Mean values of 100 AP vG–pH response amplitudes in WT, CNAαKD, or CNAβKD neurons. WT100AP = 0.163 ± 0.029 (n = 7), CNAαKD100AP = 0.023 ± 0.010 (n = 9), and CNAβKD100AP = 0.181 ± 0.060 (n = 10). **p < 0.01. F, The 100 AP vG–pH response amplitude distribution from single boutons from WT (black), CNAαKD (red), and CNAβKD (blue) neurons.
Figure 2.
Figure 2.
CNAα and CDK5 regulate 1AP-stimulated vesicle release at nerve terminals. A, Ensemble average traces of 1AP-stimulated exocytosis reported by vG–pH in WT, CNAαKD, and CDK5KD synapses. B, Mean values of 1AP vG–pH response amplitudes normalized to WT in WT, CNAαKD, CDK5KD, and WT neurons treated with roscovitine (Ros). WT1AP = 1.00 ± 0.12 (n = 20), CNAαKD1AP = 0.23 ± 0.08 (n = 8), CDK5KD1AP = 1.61 ± 0.13 (n = 8), and WT + Ros1AP = 1.65 ± 0.25 (n = 10). C, Ensemble average of 1AP-stimulated exocytosis recorded by vG–pH in WT and WT with Ros and CSA simultaneously. D, Mean values of 1AP responses of vG–pH in WT and WT with Ros and CSA simultaneously. WT1AP = 1.00 ± 0.12, and WT + Ros + CSA1AP = 1.05 ± 0.09 (n = 9). E, Ensemble average of 1AP-stimulated exocytosis recorded by vG–pH in CNAαKD and CNAαKD with Ros. F, Mean values of 1AP vG–pH responses in CNAαKD and CNAαKD treated with Ros. CNAαKD1AP = 0.17 ± 0.06, and CNAαKD + CSA1AP = 0.19 ± 0.06 (n = 8). G, Mean amplitudes of 1AP vG–pH response in WT neurons normalized to control WT condition for ω-agatoxin IVA (Aga) or ω-conotoxin GVIA (Cono) treatments: WT1AP = 1 ± 0.18 (n = 17), WT + Aga1AP = 0.52 ± 0.13 (n = 7), and WT + Cono1AP = 0.28 ± 0.04 (n = 10). H, Mean amplitudes of 1AP vG–pH responses in CNAαKD neurons normalized to control WT conditions for ω-agatoxin IVA and ω-conotoxin GVIA treatments: CNAαKDonly1AP = 0.17 ± 0.09 (n = 16), CNAαKD + Aga1AP = 0.06 ± 0.06 (n = 10), and CNAαKD + Cono1AP = 0.16 ± 0.04 (n = 6). I, Mean amplitudes of 1AP vG–pH response in WT neurons normalized to WT control condition for Aga and Aga + Ros treatments: WT1AP = 1 ± 0.24 (n = 5), WT + Aga1AP = 0.50 ± 0.12 (n = 5), and WT + Aga + Ros1AP = 1.17 ± 0.15 (n = 5). J, Mean amplitudes of 1AP vG–pH response in WT neurons normalized to WT control condition for Cono and ω-Cono + Ros treatments: WT1AP = 1 ± 0.13 (n = 9), WT + Cono1AP = 0.30 ± 0.1 (n = 9), and WT + Cono + Ros1AP = 0.35 ± 0.07 (n = 9). *p < 0.05, **p < 0.01. NS, Not significantly different.
Figure 3.
Figure 3.
CNAα and CDK5 regulate AP-stimulated Ca2+ influx at nerve terminals. A, Representative images of VAMP2–mCh and its corresponding Fluo5F kymograph image for 1AP stimulation in WT. B, Representative 1AP Fluo5F traces before (black) and after (red) EGTA-AM with CSA (blue) in WT (left) and CNAαKD (right) neurons. Arrow indicates 1AP point. C, Mean value of Fluo5F 1AP response amplitudes before and after EGTA-AM with/without CSA in WT and CNAαKD neurons: WTBefore 1AP = 2.92 ± 0.26, WTEGTA-AM 1AP = 1.40 ± 0.17, WTEGTA-AM + CSA 1AP = 0.89 ± 0.10 (n = 8), CNAαKDBefore 1AP = 1.38 ± 0.11, CNAαKDEGTA-AM 1AP = 0.73 ± 0.06, and CNAαKDEGTA-AM + CSA 1AP = 0.71 ± 0.09 (n = 9). D, Representative 1AP Fluo5F traces before (black) and after (red) EGTA-AM with roscovitine (Ros) (blue) in WT (left) and CDK5KD (right) neurons. Arrow indicates 1AP point. E, Mean value of Fluo5F 1AP response amplitudes before and after EGTA with/without roscovitine in WT and CDK5KD neurons: WTBefore 1AP = 2.76 ± 0.51, WTEGTA-AM 1AP = 1.45 ± 0.26, WTEGTA-AM + Ros 1AP = 1.90 ± 0.33 (n = 7), CDK5KDBefore 1AP = 3.81 ± 0.56, CDK5KDEGTA-AM 1AP = 2.32 ± 0.35, and CDK5KDEGTA-AM + Ros 1AP = 2.36 ± 0.37 (n = 8). F, Left, Representative 1AP Fluo5F traces before (black) and after (red) EGTA-AM with Ros and CSA (blue) in WT neurons. Right, Mean value of Fluo5F 1AP response amplitudes before and after EGTA-AM with/without Ros and CSA in WT neurons: WTBefore 1AP = 2.73 ± 0.19, WTEGTA-AM-1AP = 1.57 ± 0.10, and WTEGTA-AM + Ros + CSA 1AP = 1.63 ± 0.23 (n = 5). G, Left, Representative 1AP Fluo5F traces before (black) and after (red) EGTA-AM with Ros (blue) in CNAαKD neurons. Right, Mean value of Fluo5F 1AP response amplitudes before and after EGTA-AM with/without Ros in CNAαKD neurons: CNAαKDBefore 1AP = 1.87 ± 0.33, CNAαKDEGTA-AM 1AP = 0.89 ± 0.14, and CNAαKDEGTA-AM + Ros 1AP = 0.97 ± 0.20. (n = 5).
Figure 4.
Figure 4.
Manipulation of exocytosis and Ca2+ influx at 1.2 mm external Ca2+. A, Comparison of mean values of 1AP-driven exocytosis reported by vG–pH at 1.2 and 4 mm external Ca2+ with/without roscovitine (Ros) (expressed as percentage of NH4Cl): 1.2 mmRos− = 0.098 ± 0.016, 1.2 mmRos+ = 0.382 ± 0.068 (n = 15), 4 mmRos− = 1.23 ± 0.16, and 4 mmRos+ = 2.04 ± 0.3 (n = 10). B, Normalized response to exocytosis without Ros (Ros−) at 1.2 or 4 mm Ca2+: 1.2 mmRos− = 1.00 ± 0.16, 1.2 mmRos+ = 3.88 ± 0.68 (n = 15), 4 mmRos− = 1.00 ± 0.14, and 4 mmRos+ = 1.65 ± 0.25 (n = 10). C, Representative trace of Fluo5F to 1AP at 1.2 mm external Ca2+ with/without Ros in WT synapses. D, Normalized mean values of 1AP-driven Fluo5F response amplitudes with/without Ros at 1.2 mm external Ca2+. 1.2 mmRos− = 1.00 ± 0.17, and 1.2 mmRos+ = 1.28 ± 0.23 (n = 7). E, Comparison of response modulation by blocking either CNAα or CDK5 with the known Ca2+ dependence of exocytosis in this system. This curve has a Hill coefficient of 3.4 and is normalized along the x-axis to the Ca2+ influx obtained using 2 mm external CaCl2 (Ariel and Ryan, 2010). For comparison, we mapped the results of the experiments with CNAα and CDK5 manipulations on exocytosis and Ca2+ influx relative to the controls [measured at 2 different external Ca2+ concentrations, 1.2 mm (blue) and 4 mm (red), in this study]. Value of 1.2 mm Ca2+ on x-axis is calculated as relative value from 4 mm Ca2+ value. The data appear to fall along the originally mapped Ca2+ influx curve, suggesting that the full effect of CNAα and CDK5 inhibition on exocytosis can be attributed to changes in Ca2+ influx.
Figure 5.
Figure 5.
Comparison of 1AP-driven Ca2+ influx with three different calcium indicators: GCaMP3, Fluo5F, and MgGreen. A–C, Ensemble average traces of 1AP-triggered Ca2+ influx responses of linearized Physin–GCaMP3 (A), Fluo5F (B), or MgGreen (C) in VAMP–mCh-positive puncta in WT (black) and CNAαKD (red) neurons. D, E, Ensemble average traces of 1AP-triggered Ca2+ influx responses of linearized Physin–GCaMP3 (D) or Fluo5F (E) in VAMP–mCh-positive puncta in WT (black) and CDK5KD (red) neurons. F, Normalized mean values of 1AP-triggered Ca2+ influx. GCaMP3CNAαKD 1AP = 0.42 ± 0.04 (n = 7), Fluo5FCNAαKD 1AP = 0.47 ± 0.06 (n = 9), MgGreenCNAαKD 1AP = 0.47 ± 0.11 (n = 6), GCaMP3CDK5KD 1AP = 1.42 ± 0.16 (n = 10), and Fluo5FCNAαKD 1AP = 1.38 ± 0.20 (n = 8).
Figure 6.
Figure 6.
CNAα and CDK5 regulate N-type but not P/Q-type Ca2+ channels at hippocampal synapses and soma. A–D, Measurement of Ca2+ influx with synaptophysin–GCaMP3 at presynaptic terminal with/without ω-agatoxin IVA or ω-conotoxin GVIA in WT and CNAαKD neurons. A, Mean linearized 1AP GCaMP3 response amplitudes at boutons in WT neurons normalized to control condition for ω-agatoxin IVA (Aga) or ω-conotoxin GVIA (Cono) treatments: WTboutons 1AP = 1.00 ± 0.07 (n = 24), WT + Agaboutons 1AP = 0.80 ± 0.07 (n = 16), and WT + Conoboutons 1AP = 0.50 ± 0.07 (n = 8). B, Mean linearized 1AP GCaMP3 responses in CNAαKD neurons normalized to control WT conditions for Aga and Cono treatments: CNAαKDboutons 1AP = 0.49 ± 0.08 (n = 14), CNAαKD + Agaboutons 1AP = 0.35 ± 0.03 (n = 6), and CNAαKD + Conoboutons 1AP = 0.44 ± 0.04 (n = 8). C, Mean linearized 1AP GCaMP3 response amplitudes in WT neurons normalized to WT control condition for Aga and Aga + roscovitine (Ros) treatments: WTboutons 1AP = 1.00 ± 0.03, WT + Agaboutons 1AP = 0.75 ± 0.07, and WT + Aga + Rosboutons 1AP = 1.05 ± 0.10 (n = 7). D, Mean linearized 1AP GCaMP3 response amplitudes in WT neurons normalized to WT control condition for ω-conotoxin GVIA (Cono) and Cono + Ros treatments: WTboutons 1AP = 1.00 ± 0.10, WT + Conoboutons 1AP = 0.63 ± 0.12, and WT + Cono + Rosboutons 1AP = 0.66 ± 0.11 (n = 7). E–H, Measurement of somatic Ca2+ influx with Fluo5F with/without ω-agatoxin IVA or ω-conotoxin GVIA and roscovitine in WT neurons. E, Mean 1AP response amplitudes of Ca2+ influx at cell somas in WT neurons normalized to control condition for Aga or Cono treatments: WTsoma 1AP = 1.00 ± 0.03 (n = 23), WT + Agasoma 1AP = 0.66 ± 0.03 (n = 9), and WT + Conosoma 1AP = 0.85 ± 0.02 (n = 14). F, Mean 1AP response amplitudes of Ca2+ influx at cell body with/without roscovitine or CSA: WTsoma 1AP = 1.00 ± 0.09 (n = 19), WT + Rossoma 1AP = 1.15 ± 0.14 (n = 9), and WT + CSAsoma 1AP = 0.77 ± 0.06 (n = 10). G, Mean 1AP response amplitudes of Ca2+ influx at cell body with Aga and Aga + Ros treatments: WTsoma 1AP = 1.00 ± 0.04, WT + Agasoma 1AP = 0.66 ± 0.04, and WT + Aga + Rossoma 1AP = 0.76 ± 0.06 (n = 7). H, Mean 1AP response amplitudes of Ca2+ influx at cell body with Cono and Cono + Ros treatments: WTsoma 1AP = 1.00 ± 0.13, WT + Conosoma 1AP = 0.79 ± 0.09, and WT + Cono + Rossoma 1AP = 0.84 ± 0.08. (n = 6). **p < 0.01. NS, Not significantly different.
Figure 7.
Figure 7.
CNAα and CDK5 gate silent presynaptic boutons by controlling Ca2+ influx. A, Representative 1AP GCaMP3 difference image (ΔF1AP) in WT neurons in the absence or presence of CSA (top) or roscovitine (Ros) (bottom). Ionomycin treatment (right) reveals all presynaptic boutons. White circles indicate boutons that were silenced after treatment with CSA (top) or unsilenced after treatment of Ros (bottom). Scale bar, 5 μm. B, Corresponding traces of silenced (white circle in A, top) and unsilenced (white circle in A, bottom) boutons with or without treatment of CSA or Ros. C, Histogram of the fraction of silent and responsive boutons measured by GCaMP3 in WT with or without CSA or roscovitine: WTsilent = 0.17 ± 0.04, WTresponsive = 0.83 ± 0.04 (n = 25), WT + CSAsilent = 0.46 ± 0.09, WT + CSAresponsive = 0.54 ± 0.09 (n = 9), WT + Rossilent = 0.07 ± 0.02, and WT + Rosresponsive = 0.93 ± 0.02 (n = 16). D, Histogram of the proportion of silent and responsive boutons measured by MgGreen in WT with or without CSA or Ros. The division of silent or responsive boutons was based on a signal-to-noise ratio of 1 (peak vs SD of baseline) for the 1AP response: WTsilent = 0.14 ± 0.03, WTresponsive = 0.86 ± 0.03 (n = 19), WT + CSAsilent = 0.36 ± 0.11, WT + CSAresponsive = 0.64 ± 0.11 (n = 7), WT + Rossilent = 0.04 ± 0.02, and WT + Rosresponsive = 0.96 ± 0.02 (n = 10). E, Histogram of the fraction of silent boutons measured by GCaMP3 and normalized to fraction of WT silent boutons in WT, CNAαKD, CDK5KD, WT with/without CSA or roscovitine, and WT with ω-conotoxin GVIA (Cono) or ω-agatoxin IVA (Aga) with/without roscovitine: WT = 1.0 ± 0.18 (n = 25), CNAαKD = 3.00 ± 0.24 (n = 26), CDK5KD = 0.36 ± 0.09 (n = 12), WT + CSA = 2.70 ± 0.54 (n = 9), WT + Ros = 0.40 ± 0.09 (n = 16), WT + Cono = 3.31 ± 0.66, WT + Cono + Ros = 2.85 ± 0.60 (n = 7), WT + Aga = 1.87 ± 0.16, and WT + Aga + Ros = 0.76 ± 0.40 (n = 8).

Similar articles

Cited by

References

    1. Agler HL, Evans J, Tay LH, Anderson MJ, Colecraft HM, Yue DT. G protein-gated inhibitory module of N-type (ca(v)2.2) Ca2+ channels. Neuron. 2005;46:891–904. doi: 10.1016/j.neuron.2005.05.011. - DOI - PubMed
    1. Anggono V, Smillie KJ, Graham ME, Valova VA, Cousin MA, Robinson PJ. Syndapin I is the phosphorylation-regulated dynamin I partner in synaptic vesicle endocytosis. Nat Neurosci. 2006;9:752–760. doi: 10.1038/nn1695. - DOI - PMC - PubMed
    1. Ariel P, Ryan TA. Optical mapping of release properties in synapses. Front Neural Circuits. 2010;4 doi: 10.3389/fncir.2010.00018. pii.18. - DOI - PMC - PubMed
    1. Ariel P, Hoppa MB, Ryan TA. Intrinsic variability in Pv, RRP size, Ca2+ channel repertoire, and presynaptic potentiation in individual synaptic boutons. Front Synaptic Neurosci. 2012;4:9. doi: 10.3389/fnsyn.2012.00009. - DOI - PMC - PubMed
    1. Bibb JA, Snyder GL, Nishi A, Yan Z, Meijer L, Fienberg AA, Tsai LH, Kwon YT, Girault JA, Czernik AJ, Huganir RL, Hemmings HC, Jr, Nairn AC, Greengard P. Phosphorylation of DARPP-32 by Cdk5 modulates dopamine signalling in neurons. Nature. 1999;402:669–671. doi: 10.1038/45251. - DOI - PubMed

Publication types

MeSH terms

LinkOut - more resources