. 2013 May 22;33(21):9056-67.
doi: 10.1523/JNEUROSCI.3870-12.2013.

PI3K-Akt signaling activates mTOR-mediated epileptogenesis in organotypic hippocampal culture model of post-traumatic epilepsy

Affiliations

PI3K-Akt signaling activates mTOR-mediated epileptogenesis in organotypic hippocampal culture model of post-traumatic epilepsy

Yevgeny Berdichevsky et al. J Neurosci. .

Abstract

mTOR is activated in epilepsy, but the mechanisms of mTOR activation in post-traumatic epileptogenesis are unknown. It is also not clear whether mTOR inhibition has an anti-epileptogenic, or merely anticonvulsive effect. The rat hippocampal organotypic culture model of post-traumatic epilepsy was used to study the effects of long-term (four weeks) inhibition of signaling pathways that interact with mTOR. Ictal activity was quantified by measurement of lactate production and electrical recordings, and cell death was quantified with lactate dehydrogenase (LDH) release measurements and Nissl-stained neuron counts. Lactate and LDH measurements were well correlated with electrographic activity and neuron counts, respectively. Inhibition of PI3K and Akt prevented activation of mTOR, and was as effective as inhibition of mTOR in reducing ictal activity and cell death. A dual inhibitor of PI3K and mTOR, NVP-BEZ235, was also effective. Inhibition of mTOR with rapamycin reduced axon sprouting. Late start of rapamycin treatment was effective in reducing epileptic activity and cell death, while early termination of rapamycin treatment did not result in increased epileptic activity or cell death. The conclusions of the study are as follows: (1) the organotypic hippocampal culture model of post-traumatic epilepsy comprises a rapid assay of anti-epileptogenic and neuroprotective activities and, in this model (2) mTOR activation depends on PI3K-Akt signaling, and (3) transient inhibition of mTOR has sustained effects on epilepsy.


Figures
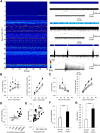
Figure 1.
Figure 1.
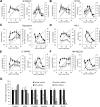
Validation of lactate and LDH measurements as biomarkers for epileptic activity and cell death. A, Representative time course of epileptogenesis in an organotypic hippocampal culture. Colors correspond to the frequency of paroxysmal event occurrence in 10 s bins, with examples shown on the right. Deep blue, multiunit activity (top trace); light blue or yellow, interictal activity (middle trace); red, electrographic seizures (ictal events, bottom trace). B, C, time course of lactate (B) and LDH (C) concentration and cumulative production in epileptic controls (♦) and cultures treated with phenytoin (▵), and KYNA (□); n = 12 each condition. Error bars indicate SEM. Statistical significance is shown for epileptic controls versus KYNA-treated cultures, with *p < 0.05, **p < 0.01, and ***p < 0.001. Statistically significant differences between epileptic controls and phenytoin-treated cultures were the same as control versus KYNA, except for lactate at DIV <{28,32}> and LDH at DIV <{21,24}> and <{28,32}>, where no statistically significant differences were found. D, Relationship of lactate concentration and activity, during time periods when only physiological or interictal activity was present (○) or when ictal activity was present (●). Lactate concentrations were plotted versus the duration of electrical activity, with each data point corresponding to the time between medium changes. Exponential fit line is shown. E, Relationship between LDH concentration in culture supernatant and the number of dead (PI-positive) cells. LDH concentrations and numbers of PI-stained dead cells were measured in the same cultures, with each time point again corresponding to the time between medium changes (LDH accumulated in the culture medium since last medium change vs number of PI cells at the time of medium change). Linear fit line is shown. F, Lactate production (average ± SD, ***p < 0.001) during time periods with and without ictal vents, from data shown in D. G, LDH release (average ± SD, ***p < 0.001) from cultures during time periods with and without ictal events, from data in E.
Figure 2.
Figure 2.
Screen of inhibitors. A, SP 600125, JNK inhibitor. B, U0126, MEK inhibitor. C, Rapamycin, mTOR inhibitor. D, API-2, Akt inhibitor. E, LY 294002, PI3K inhibitor. F, NVP-BEZ235, dual PI3K/mTOR inhibitor. n = 3 per data point, for cultures with vehicle (●) and inhibitor treatment (○) lactate, and for cultures with vehicle (♢) and inhibitor treatment (♦) LDH. Cumulative averages of lactate and LDH production are plotted in each figure as solid gray line (vehicle-treated cultures) or dashed gray line (inhibitor-treated cultures). G, Summary of the data at the day of peak lactate production. N = 3 for both controls and treated slices for all groups except rapamycin (n = 6) and LY 294002 (n = 6). Error bars indicate SD.
Figure 3.
Figure 3.
Lactate and LDH concentrations show dose–response to varying concentrations of inhibitors. A, Dose–response to chronic API-2 treatment, n = 3 per point/condition. B, Dose–response to chronic NVP-BEZ235 treatment, n = 3 per point/condition. Concentrations are shown in the figure. Error bars indicate SD.
Figure 4.
Figure 4.
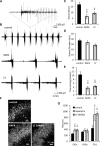
Electrical recordings and neuronal counts confirm that LY 294002 (LY) and rapamycin (RAPA) treatments reduce number of ictal events and promote neuronal survival. A, Typical ictal event in an epileptic control culture. B, Representative electrical recordings from control, rapamycin, and LY 294002-treated cultures. Rapamycin and LY 294002 treatments reduce seizure frequency (C), but not seizure duration (D), with the overall effect of reducing the time spent in ictal state (E). **p < 0.01, ***p < 0.001. F, Representative images of Nissl-stained organotypic hippocampal cultures at 28 DIV. Scale bars, 50 μm. G, Neuronal counts revealed that more neurons survive in CA3c and CA1 of rapamycin and LY 294002-treated cultures compared with epileptic controls, n = 3 per condition, **p < 0.01, ***p < 0.001.
Figure 5.
Figure 5.
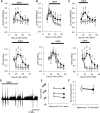
Effects of different time courses of rapamycin (RAPA) treatment on progression of epilepsy. A, Rapamycin is applied 3 to 28 DIV, 10–28 DIV (B), 3–17 DIV (C). Control lactate concentrations are plotted as ●, while lactate concentrations in the rapamycin experimental group are plotted as ○. LDH concentrations are plotted as ♦ for control group, and ♢ for rapamycin group. N = 6 per condition, per data point, *p < 0.05, **p < 0.01, ***p < 0.001. D, Representative electrical recording of a culture that was chronically treated with rapamycin, showing no change in activity upon rapamycin wash-out. E, Results of rapamycin washout in three cultures, ○ represents power of electrical activity in rapamycin, and ● power of activity after wash-out. F, Comparison of seizure activity in rapamycin-treated cultures at 17 DIV (empty circle), and cultures in which rapamycin treatment was discontinued starting at 17 DIV for 11 d (filled circle).
Figure 6.
Figure 6.
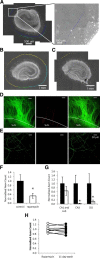
mTOR inhibition reduces axon sprouting. A, Left, Stitched micrographs show organotypic hippocampal culture and surrounding area with sprouted axons. The inset shows sprouting axons with quantification markers at different distances from the culture. B, C, Representative images of a control culture (B) and rapamycin-treated culture (C) are shown at 8 DIV, with marks corresponding to axons crossing the contour 900 μm away from CA3 (blue), DG (green), or CA1 and subiculum (yellow) border. D, Representative SMI-312 (green) and MAP-2 (red) staining of processes at the edge (white line) of an 8 DIV organotypic culture; right image is merged SMI-312 and MAP-2 staining (stratum oriens, SO). E, Representative SMI-312 (green, left image) and MAP-2 (red, middle image), and merged SMI-312/MAP-2 (right image) staining of processes 900 μm away from the edge of an 8 DIV organotypic culture. F, Comparison of the numbers of axons crossing 900 μm contour in rapamycin or vehicle-treated cultures (n = 8, p < 0.05), G, Numbers of axons originating from different areas of the hippocampal culture, *p < 0.05. H, Comparison of the numbers of axons crossing 900 μm contour in rapamycin-treated cultures at 17 DIV (empty circles) versus axons in the same cultures 11 d after discontinuation of rapamycin treatment (filled circles).
Figure 7.
Figure 7.
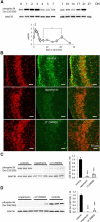
Phosphorylation of S6 ribosomal protein is reduced with chronic rapamycin or LY 294002 treatment. A, Changes in S6 phosphorylation with time in vitro. Top: Representative Western blots of phospho-S6 (Ser 235/236) and total S6, from 0 to 7 DIV, and from 7 to 27 DIV. Bottom, Ratios of phospho-S6 (Ser 235/236) to total S6 are plotted (n = 4, average +/− STD, *p < 0.05, **p < 0.01). B, Immunohistochemistry micrographs of cultures with different treatments, Nissl stain is shown in red and phosphor-S6 is in green. C, Representative Western blot of pS6 (Ser235/236) and total S6 and comparison of pS6 (Ser 235/236)/S6 ratio in cultures treated with vehicle, rapamycin, or LY 293002. D, Representative Western blot of pS6 (Ser 240/244) and total S6, and comparison of pS6 (Ser 240/244)/S6 ratio in cultures treated with vehicle, rapamycin, or LY 294002 (***p < 0.001).

Similar articles

Cited by

References

    1. Berdichevsky Y, Dzhala V, Mail M, Staley KJ. Interictal spikes, seizures and ictal cell death are not necessary for post-traumatic epileptogenesis in vitro. Neurobiol Dis. 2012;45:774–785. doi: 10.1016/j.nbd.2011.11.001. - DOI - PMC - PubMed
    1. Bonfoco E, Krainc D, Ankarcrona M, Nicotera P, Lipton SA. Apoptosis and necrosis: two distinct events induced, respectively, by mild and intense insults with N-methyl-D-aspartate or nitric oxide/superoxide in cortical cell cultures. Proc Natl Acad Sci U S A. 1995;92:7162–7166. doi: 10.1073/pnas.92.16.7162. - DOI - PMC - PubMed
    1. Borders EB, Bivona C, Medina PJ. Mammalian target of rapamycin: biological function and target for novel anticancer agents. Am J Health Syst Pharm. 2010;67:2095–2106. doi: 10.2146/ajhp100020. - DOI - PubMed
    1. Buckmaster PS, Ingram EA, Wen X. Inhibition of the mammalian target of rapamycin signaling pathway suppresses dentate granule cell axon sprouting in a rodent model of temporal lobe epilepsy. J Neurosci. 2009;29:8259–8269. doi: 10.1523/JNEUROSCI.4179-08.2009. - DOI - PMC - PubMed
    1. Caron E, Ghosh S, Matsuoka Y, Ashton-Beaucage D, Therrien M, Lemieux S, Perreault C, Roux PP, Kitano H. A comprehensive map of the mTOR signaling network. Mol Syst Biol. 2010;6:453. - PMC - PubMed

Publication types

MeSH terms

LinkOut - more resources