Global methylation analysis identifies prognostically important epigenetically inactivated tumor suppressor genes in multiple myeloma
- PMID: 23699600
- PMCID: PMC3709654
- DOI: 10.1182/blood-2013-03-487884
Global methylation analysis identifies prognostically important epigenetically inactivated tumor suppressor genes in multiple myeloma
Abstract
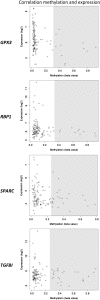
Outcome in multiple myeloma is highly variable and a better understanding of the factors that influence disease biology is essential to understand and predict behavior in individual patients. In the present study, we analyzed combined genomewide DNA methylation and gene expression data of patients treated in the Medical Research Council Myeloma IX trial. We used these data to identify epigenetically repressed tumor suppressor genes with prognostic relevance in myeloma. We identified 195 genes with changes in methylation status that were significantly associated with prognosis. Combining DNA methylation and gene expression data led to the identification of the epigenetically regulated tumor modulating genes GPX3, RBP1, SPARC, and TGFBI. Hypermethylation of these genes was associated with significantly shorter overall survival, independent of age, International Staging System score, and adverse cytogenetics. The 4 differentially methylated and expressed genes are known to mediate important tumor suppressive functions including response to chemotherapy (TGFBI), interaction with the microenvironment (SPARC), retinoic acid signaling (RBP1), and the response to oxidative stress (GPX3), which could explain the prognostic impact of their differential methylation. Assessment of the DNA methylation status of the identified genes could contribute to the molecular characterization of myeloma, which is prerequisite for an individualized treatment approach.
Figures


Similar articles
-
Genome-wide transcriptional response to 5-aza-2'-deoxycytidine and trichostatin a in multiple myeloma cells.Cancer Res. 2008 Jan 1;68(1):44-54. doi: 10.1158/0008-5472.CAN-07-2531. Cancer Res. 2008. PMID: 18172295
-
Genome-wide methylation and expression profiling identifies promoter characteristics affecting demethylation-induced gene up-regulation in melanoma.BMC Med Genomics. 2010 Feb 9;3:4. doi: 10.1186/1755-8794-3-4. BMC Med Genomics. 2010. PMID: 20144234 Free PMC article.
-
Genome-wide methylation profiling of ovarian cancer patient-derived xenografts treated with the demethylating agent decitabine identifies novel epigenetically regulated genes and pathways.Genome Med. 2016 Oct 20;8(1):107. doi: 10.1186/s13073-016-0361-5. Genome Med. 2016. PMID: 27765068 Free PMC article.
-
DNA methylation of tumor suppressor protein-coding and non-coding genes in multiple myeloma.Epigenomics. 2015;7(6):985-1001. doi: 10.2217/epi.15.57. Epub 2015 Sep 29. Epigenomics. 2015. PMID: 26417914 Review.
-
Gene hypermethylation in multiple myeloma: lessons from a cancer pathway approach.Clin Lymphoma Myeloma. 2008 Dec;8(6):331-9. doi: 10.3816/CLM.2008.n.048. Clin Lymphoma Myeloma. 2008. PMID: 19064397 Review.
Cited by
-
Whole-epigenome analysis in multiple myeloma reveals DNA hypermethylation of B cell-specific enhancers.Genome Res. 2015 Apr;25(4):478-87. doi: 10.1101/gr.180240.114. Epub 2015 Feb 2. Genome Res. 2015. PMID: 25644835 Free PMC article.
-
The functional epigenetic landscape of aberrant gene expression in molecular subgroups of newly diagnosed multiple myeloma.J Hematol Oncol. 2020 Aug 6;13(1):108. doi: 10.1186/s13045-020-00933-y. J Hematol Oncol. 2020. PMID: 32762714 Free PMC article.
-
The Role of Panobinostat Plus Bortezomib and Dexamethasone in Treating Relapsed or Relapsed and Refractory Multiple Myeloma: A European Perspective.Adv Ther. 2016 Nov;33(11):1896-1920. doi: 10.1007/s12325-016-0413-7. Epub 2016 Sep 27. Adv Ther. 2016. PMID: 27677481 Free PMC article. Review.
-
GPX3 hypermethylation serves as an independent prognostic biomarker in non-M3 acute myeloid leukemia.Am J Cancer Res. 2015 Apr 15;5(5):1786-94. eCollection 2015. Am J Cancer Res. 2015. PMID: 26175946 Free PMC article.
-
Integrative analysis of DNA copy number, DNA methylation and gene expression in multiple myeloma reveals alterations related to relapse.Oncotarget. 2016 Dec 6;7(49):80664-80679. doi: 10.18632/oncotarget.13025. Oncotarget. 2016. PMID: 27811368 Free PMC article.
References
-
- Morgan GJ, Walker BA, Davies FE. The genetic architecture of multiple myeloma. Nat Rev Cancer. 2012;12(5):335–348. - PubMed
-
- Walker BA, Wardell CP, Chiecchio L, et al. Aberrant global methylation patterns affect the molecular pathogenesis and prognosis of multiple myeloma. Blood. 2011;117(2):553–562. - PubMed
-
- Deneberg S, Guardiola P, Lennartsson A, et al. Prognostic DNA methylation patterns in cytogenetically normal acute myeloid leukemia are predefined by stem cell chromatin marks. Blood. 2011;118(20):5573–5582. - PubMed
Publication types
MeSH terms
Substances
Grants and funding
LinkOut - more resources
Full Text Sources
Other Literature Sources
Medical
Molecular Biology Databases
Miscellaneous

