

A finite element study on variations in mass transport in stented porcine coronary arteries based on location in the coronary arterial tree
- PMID: 23699720
- PMCID: PMC5413126
- DOI: 10.1115/1.4024137
A finite element study on variations in mass transport in stented porcine coronary arteries based on location in the coronary arterial tree
Abstract
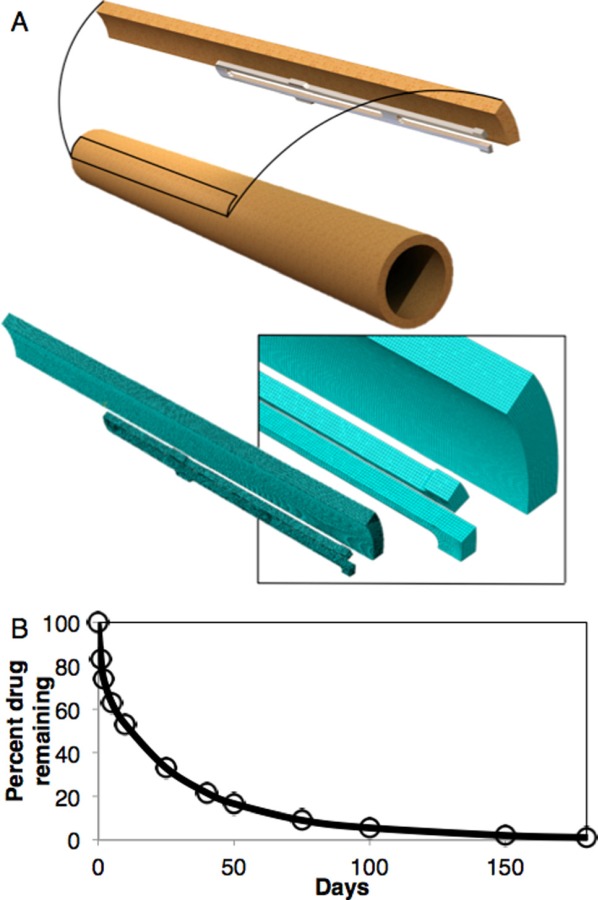
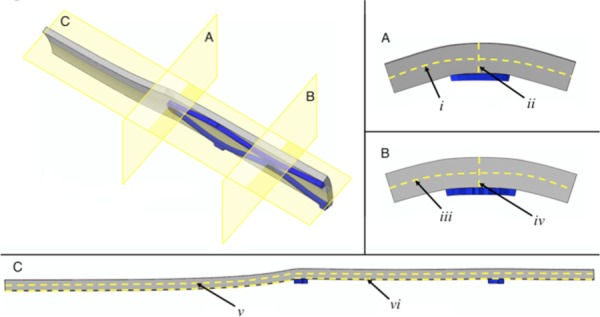
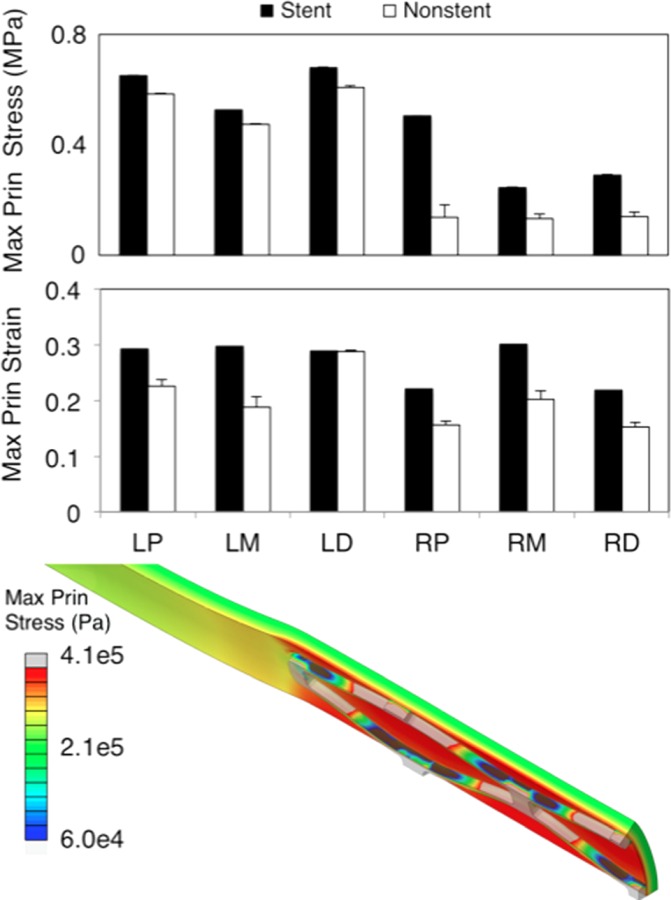
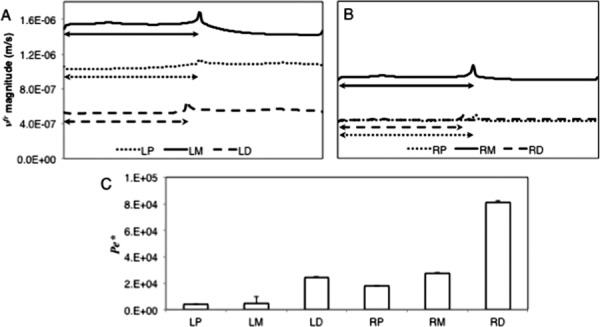
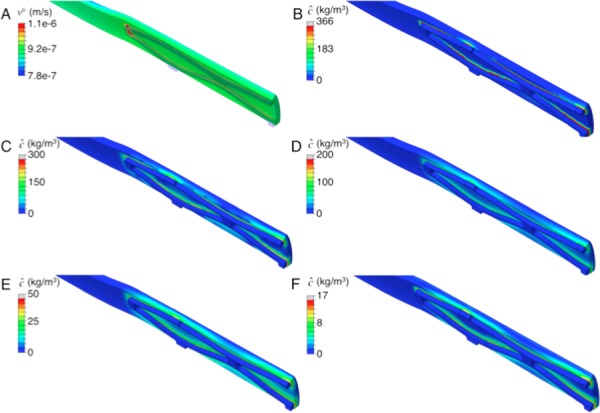
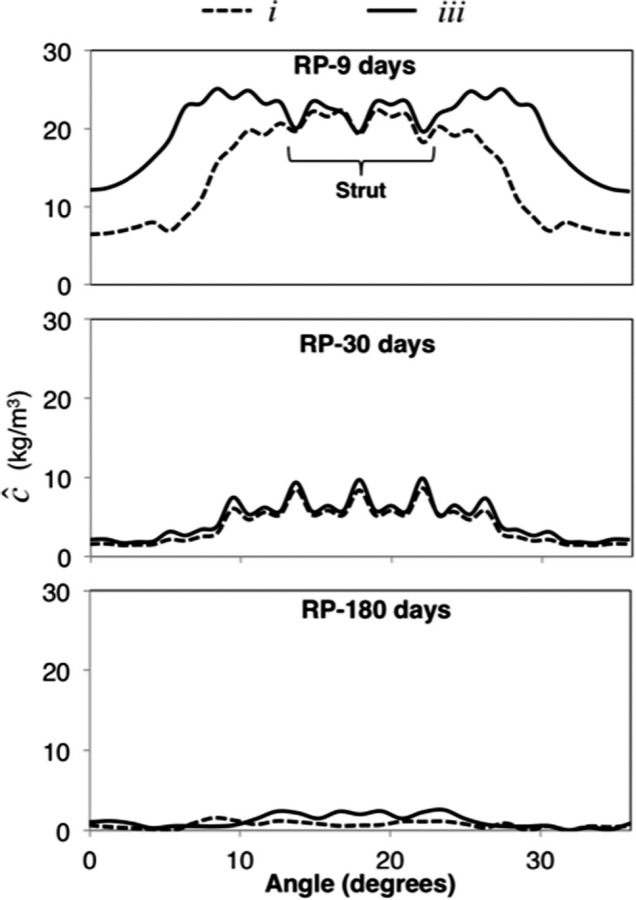
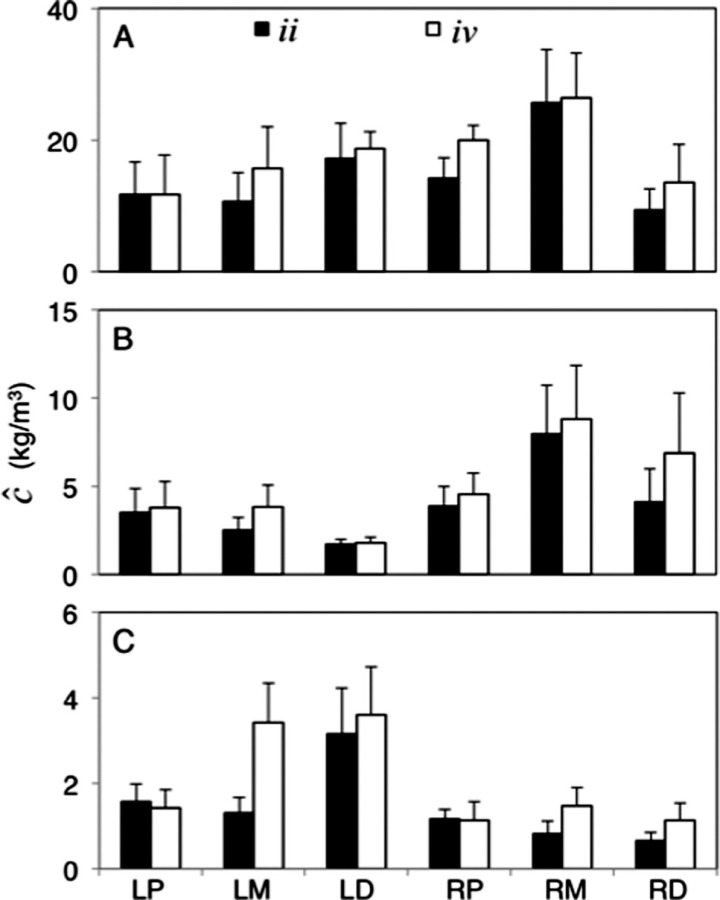
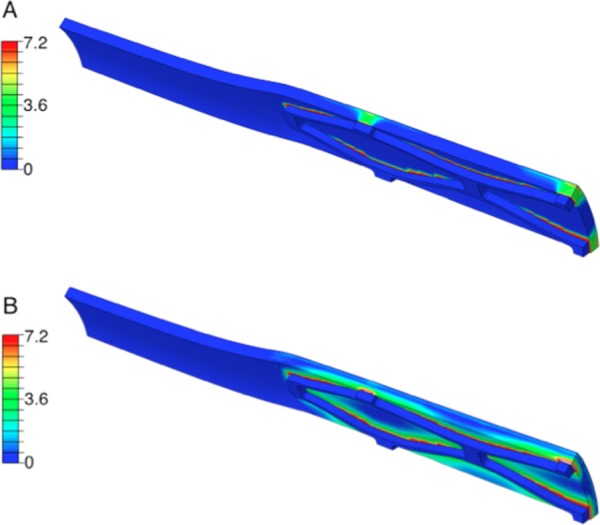
Drug-eluting stents have a significant clinical advantage in late-stage restenosis due to the antiproliferative drug release. Understanding how drug transport occurs between coronary arterial locations can better help guide localized drug treatment options. Finite element models with properties from specific porcine coronary artery sections (left anterior descending (LAD), right (RCA); proximal, middle, distal regions) were created for stent deployment and drug delivery simulations. Stress, strain, pore fluid velocity, and drug concentrations were exported at different time points of simulation (0-180 days). Tests indicated that the highest stresses occurred in LAD sections. Higher-than-resting homeostatic levels of stress and strain existed at upwards of 3.0 mm away from the stented region, whereas concentration of species only reached 2.7 mm away from the stented region. Region-specific concentration showed 2.2 times higher concentrations in RCA artery sections at times corresponding to vascular remodeling (peak in the middle segment) compared to all other segments. These results suggest that wall transport can occur differently based on coronary artery location. Awareness of peak growth stimulators and where drug accumulation occurs in the vasculature can better help guide local drug delivery therapies.
Figures
References
-
- Hwang, C. W. , Wu, D. , and Edelman, E. R. , 2003, “Impact of Transport and Drug Properties on the Local Pharmacology of Drug-Eluting Stents,” Int. J. Cardiovasc. Interv., 5(1), pp. 7–12. Available at: http://web.mit.edu/hst-program/erelab/Publications/2003%20Papers/HwangIm... - PubMed
-
- Kang, S. J. , Mintz, G. S. , Park, D. W. , Lee, S. W. , Kim, Y. H. , Whan Lee, C. , Han, K. H. , Kim, J. J. , Park, S. W. , and Park, S. J. , 2011, “Mechanisms of In-Stent Restenosis After Drug-Eluting Stent Implantation: Intravascular Ultra-sound Analysis,” Circul. Cardiovasc. Interv., 4(1), pp. 9–14. 10.1161/CIRCINTERVENTIONS.110.940320 - DOI - PubMed
-
- Keyes, J. T. , Lockwood, D. R. , Simon, B. R. , and Vande Geest, J. P. , 2013, “Deformationally Dependent Fluid Transport Properties of Porcine Coronary Arteries Based on Location in the Coronary Vasculature,” J. Mech. Bev. Biomed. Mat., 17, pp. 296–306. 10.1016/j.jmbbm.2012.10.002 - DOI - PMC - PubMed
Publication types
MeSH terms
Substances
Grants and funding
LinkOut - more resources
Full Text Sources
Other Literature Sources
Medical
