

Characterizing functional lung heterogeneity in COPD using reference equations for CT scan-measured lobar volumes
- PMID: 23699785
- PMCID: PMC3673661
- DOI: 10.1378/chest.12-1616
Characterizing functional lung heterogeneity in COPD using reference equations for CT scan-measured lobar volumes
Abstract
Background: CT scanning is increasingly used to characterize COPD. Although it is possible to obtain CT scan-measured lung lobe volumes, normal ranges remain unknown. Using COPDGene data, we developed reference equations for lobar volumes at maximal inflation (total lung capacity [TLC]) and relaxed exhalation (approximating functional residual capacity [FRC]).
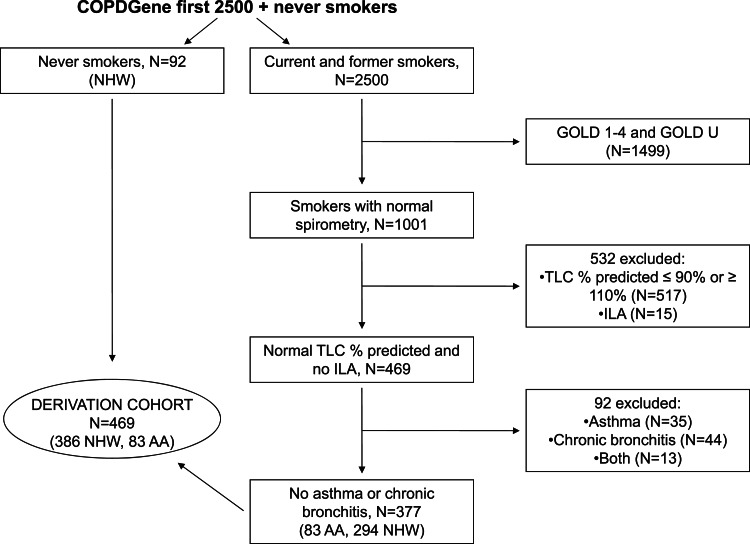
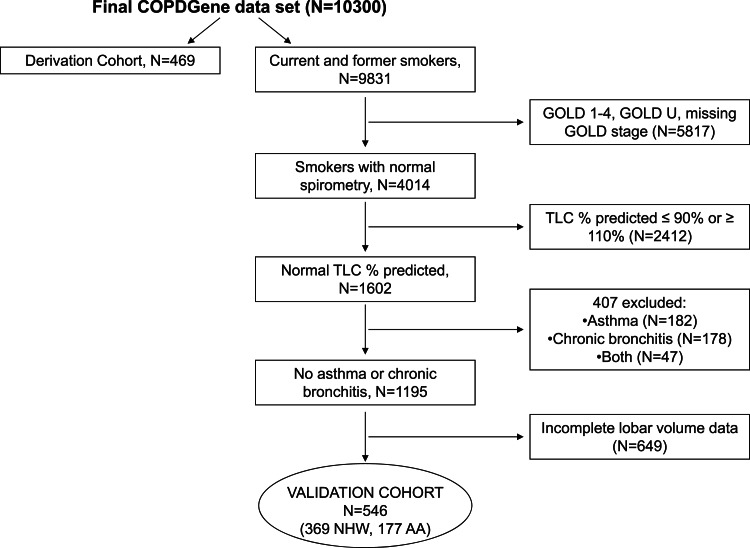
Methods: Linear regression was used to develop race-specific (non-Hispanic white [NHW], African American) reference equations for lobar volumes. Covariates included height and sex. Models were developed in a derivation cohort of 469 subjects with normal pulmonary function and validated in 546 similar subjects. These cohorts were combined to produce final prediction equations, which were applied to 2,191 subjects with old GOLD (Global Initiative for Chronic Obstructive Lung Disease) stage II to IV COPD.
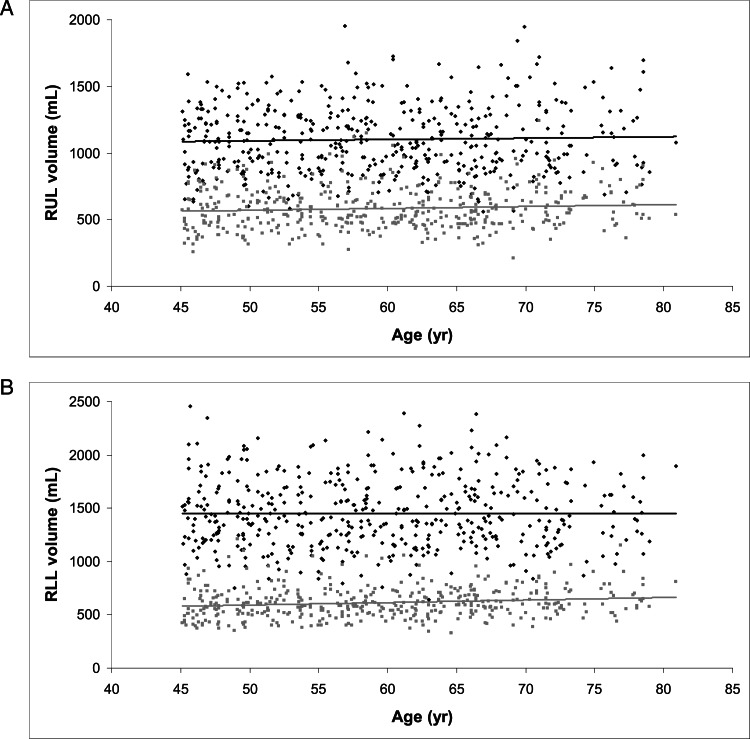
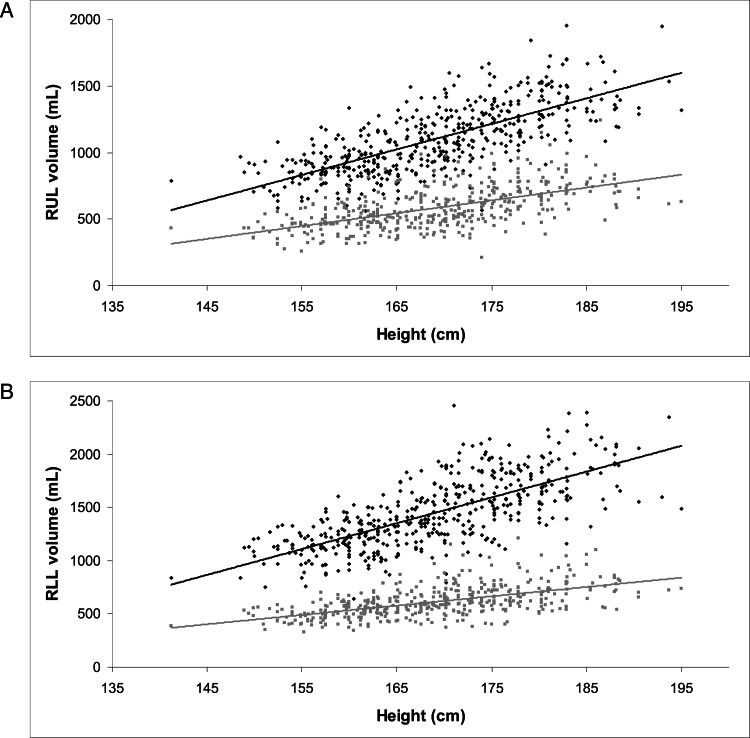
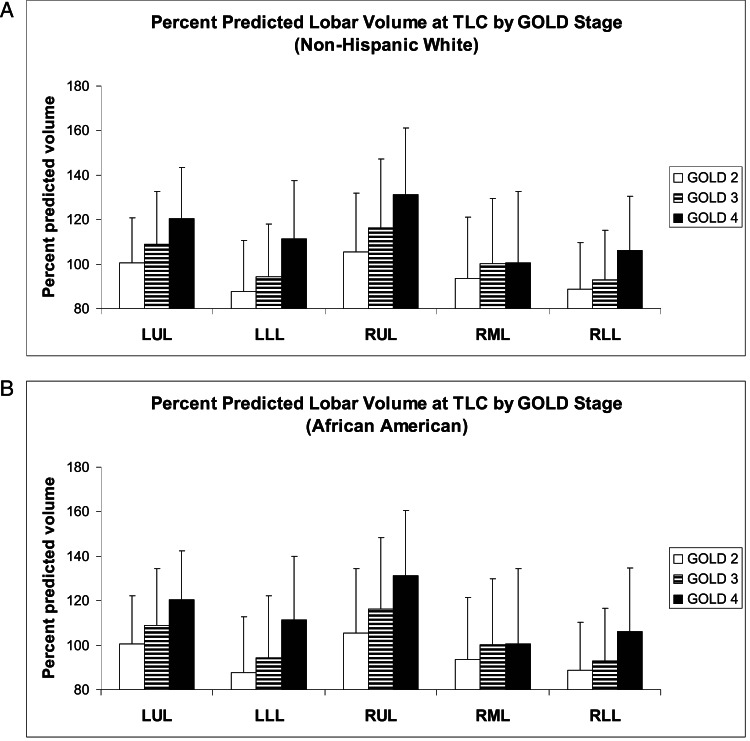
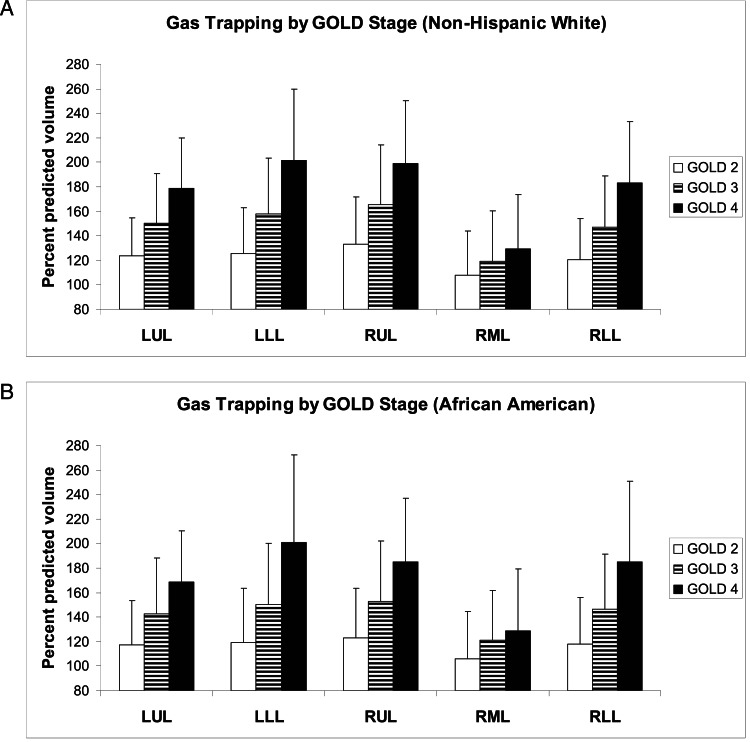
Results: In the derivation cohort, women had smaller lobar volumes than men. Height positively correlated with lobar volumes. Adjusting for height, NHWs had larger total lung and lobar volumes at TLC than African Americans; at FRC, NHWs only had larger lower lobes. Age and weight had no effect on lobar volumes at TLC but had small effects at FRC. In subjects with COPD at TLC, upper lobes exceeded 100% of predicted values in GOLD II disease; lower lobes were only inflated to this degree in subjects with GOLD IV disease. At FRC, gas trapping was severe irrespective of disease severity and appeared uniform across the lobes.
Conclusions: Reference equations for lobar volumes may be useful in assessing regional lung dysfunction and how it changes in response to pharmacologic therapies and surgical or endoscopic lung volume reduction.
Figures
References
-
- Hogg JC, Macklem PT, Thurlbeck WM. Site and nature of airway obstruction in chronic obstructive lung disease. N Engl J Med. 1968;278(25):1355-1360 - PubMed
-
- Hogg JC, Chu F, Utokaparch S, et al. The nature of small-airway obstruction in chronic obstructive pulmonary disease. N Engl J Med. 2004;350(26):2645-2653 - PubMed
-
- Hogg JC. Pathophysiology of airflow limitation in chronic obstructive pulmonary disease. Lancet. 2004;364(9435):709-721 - PubMed
-
- Stocks J, Quanjer PH; Official Statement of The European Respiratory Society Reference values for residual volume, functional residual capacity and total lung capacity. ATS Workshop on Lung Volume Measurements. Eur Respir J. 1995;8(3):492-506 - PubMed
Publication types
MeSH terms
Grants and funding
LinkOut - more resources
Full Text Sources
Other Literature Sources
Medical
