

Structural dynamics of possible late-stage intermediates in folding of quadruplex DNA studied by molecular simulations
- PMID: 23700306
- PMCID: PMC3737530
- DOI: 10.1093/nar/gkt412
Structural dynamics of possible late-stage intermediates in folding of quadruplex DNA studied by molecular simulations
Abstract
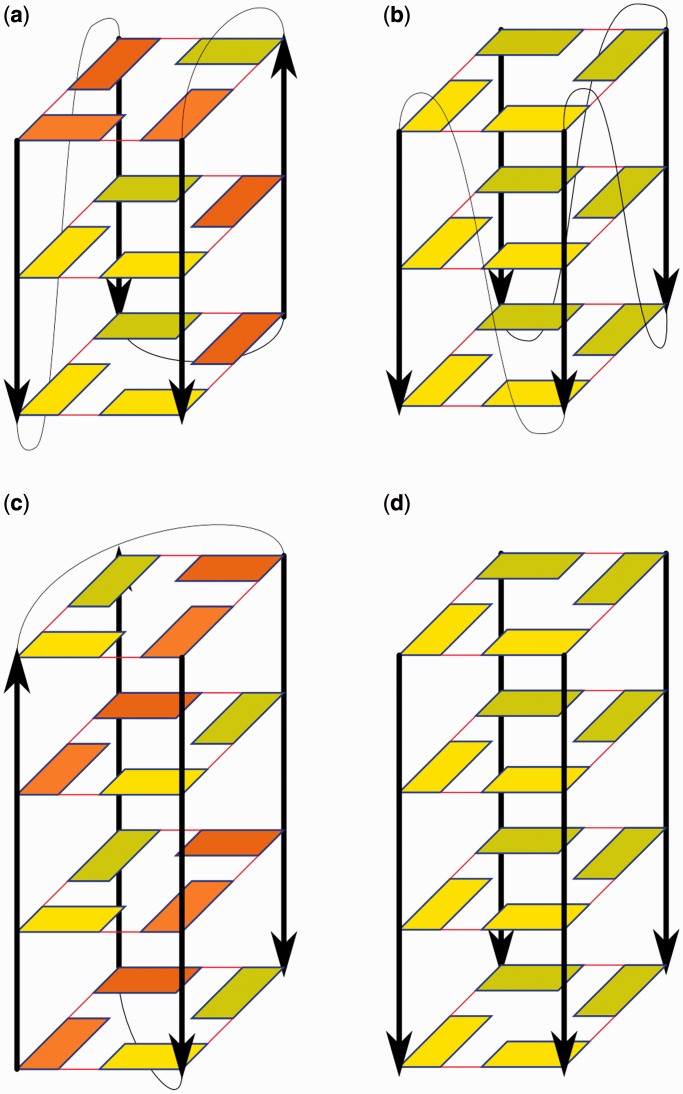
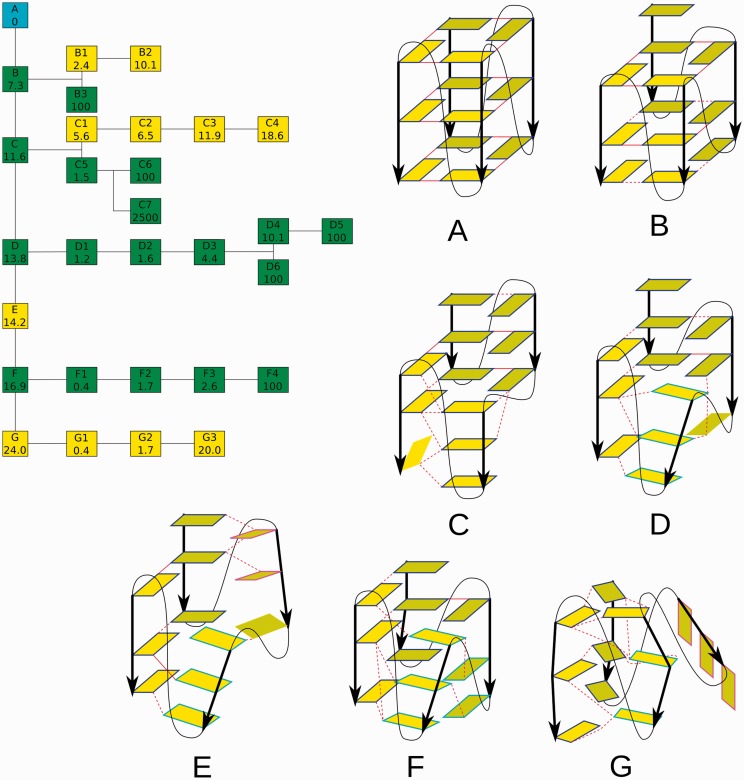
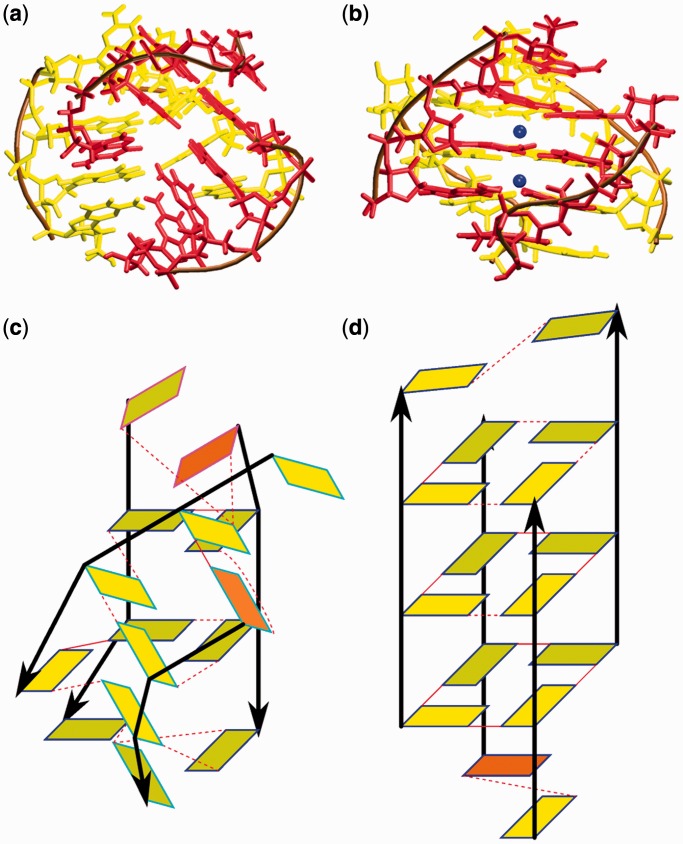
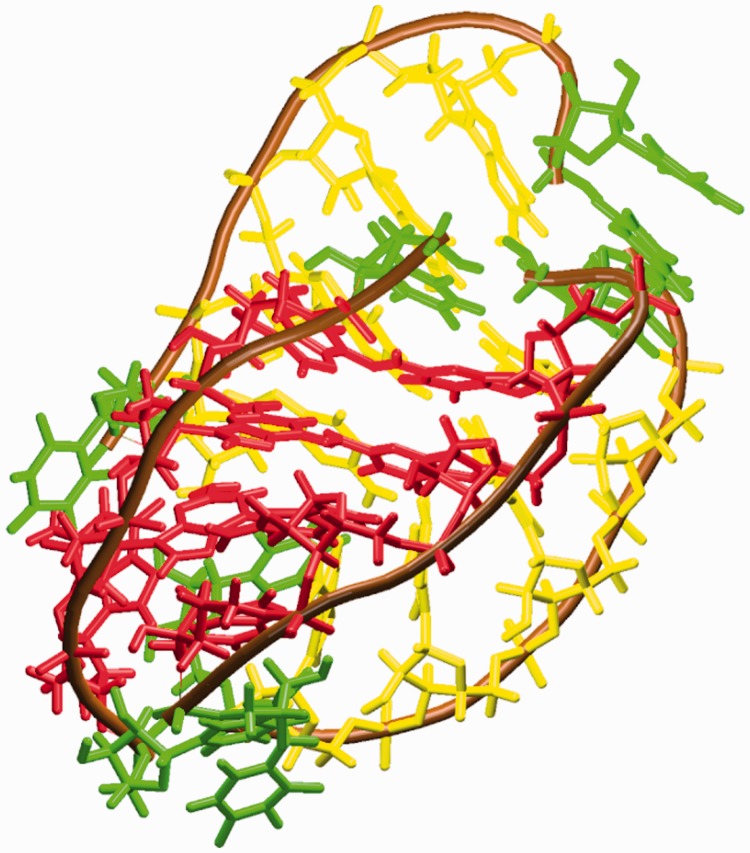
Explicit solvent molecular dynamics simulations have been used to complement preceding experimental and computational studies of folding of guanine quadruplexes (G-DNA). We initiate early stages of unfolding of several G-DNAs by simulating them under no-salt conditions and then try to fold them back using standard excess salt simulations. There is a significant difference between G-DNAs with all-anti parallel stranded stems and those with stems containing mixtures of syn and anti guanosines. The most natural rearrangement for all-anti stems is a vertical mutual slippage of the strands. This leads to stems with reduced numbers of tetrads during unfolding and a reduction of strand slippage during refolding. The presence of syn nucleotides prevents mutual strand slippage; therefore, the antiparallel and hybrid quadruplexes initiate unfolding via separation of the individual strands. The simulations confirm the capability of G-DNA molecules to adopt numerous stable locally and globally misfolded structures. The key point for a proper individual folding attempt appears to be correct prior distribution of syn and anti nucleotides in all four G-strands. The results suggest that at the level of individual molecules, G-DNA folding is an extremely multi-pathway process that is slowed by numerous misfolding arrangements stabilized on highly variable timescales.
Figures
Similar articles
-
Triplex intermediates in folding of human telomeric quadruplexes probed by microsecond-scale molecular dynamics simulations.Biochimie. 2014 Oct;105:22-35. doi: 10.1016/j.biochi.2014.07.009. Epub 2014 Jul 17. Biochimie. 2014. PMID: 25038568
-
A double chain reversal loop and two diagonal loops define the architecture of a unimolecular DNA quadruplex containing a pair of stacked G(syn)-G(syn)-G(anti)-G(anti) tetrads flanked by a G-(T-T) Triad and a T-T-T triple.J Mol Biol. 2001 Jun 29;310(1):181-94. doi: 10.1006/jmbi.2001.4759. J Mol Biol. 2001. PMID: 11419945
-
Folding intermediate states of the parallel human telomeric G-quadruplex DNA explored using Well-Tempered Metadynamics.Sci Rep. 2020 Feb 21;10(1):3176. doi: 10.1038/s41598-020-59774-x. Sci Rep. 2020. PMID: 32081872 Free PMC article.
-
Folding of guanine quadruplex molecules-funnel-like mechanism or kinetic partitioning? An overview from MD simulation studies.Biochim Biophys Acta Gen Subj. 2017 May;1861(5 Pt B):1246-1263. doi: 10.1016/j.bbagen.2016.12.008. Epub 2016 Dec 13. Biochim Biophys Acta Gen Subj. 2017. PMID: 27979677 Review.
-
Molecular dynamics simulations of G-DNA and perspectives on the simulation of nucleic acid structures.Methods. 2012 May;57(1):25-39. doi: 10.1016/j.ymeth.2012.04.005. Epub 2012 Apr 16. Methods. 2012. PMID: 22525788 Free PMC article. Review.
Cited by
-
Origin of Ion Specificity of Telomeric DNA G-Quadruplexes Investigated by Free-Energy Simulations.Biophys J. 2017 Jun 6;112(11):2280-2290. doi: 10.1016/j.bpj.2017.04.036. Biophys J. 2017. PMID: 28591601 Free PMC article.
-
A G-quadruplex-binding compound showing anti-tumour activity in an in vivo model for pancreatic cancer.Sci Rep. 2015 Jun 16;5:11385. doi: 10.1038/srep11385. Sci Rep. 2015. PMID: 26077929 Free PMC article.
-
A direct view of the complex multi-pathway folding of telomeric G-quadruplexes.Nucleic Acids Res. 2016 Dec 15;44(22):11024-11032. doi: 10.1093/nar/gkw1010. Epub 2016 Oct 30. Nucleic Acids Res. 2016. PMID: 27799468 Free PMC article.
-
Extreme mechanical diversity of human telomeric DNA revealed by fluorescence-force spectroscopy.Proc Natl Acad Sci U S A. 2019 Apr 23;116(17):8350-8359. doi: 10.1073/pnas.1815162116. Epub 2019 Apr 3. Proc Natl Acad Sci U S A. 2019. PMID: 30944218 Free PMC article.
-
A tetrahelical DNA fold adopted by tandem repeats of alternating GGG and GCG tracts.Nat Commun. 2014 Dec 15;5:5831. doi: 10.1038/ncomms6831. Nat Commun. 2014. PMID: 25500730 Free PMC article.
References
-
- De Cian A, Lacroix L, Douarre C, Temime-Smaali N, Trentesaux C, Riou JF, Mergny JL. Targeting telomeres and telomerase. Biochimie. 2008;90:131–155. - PubMed
-
- Huppert JL. Four-stranded nucleic acids: structure, function and targeting of G-quadruplexes. Chem. Soc. Rev. 2008;37:1375–1384. - PubMed
-
- Neidle S. The structures of quadruplex nucleic acids and their drug complexes. Curr. Opin. Struct. Biol. 2009;19:239–250. - PubMed
Publication types
MeSH terms
Substances
LinkOut - more resources
Full Text Sources
Other Literature Sources
Miscellaneous
