Gene expression changes in the colon epithelium are similar to those of intact colon during late inflammation in interleukin-10 gene deficient mice
- PMID: 23700416
- PMCID: PMC3659096
- DOI: 10.1371/journal.pone.0063251
Gene expression changes in the colon epithelium are similar to those of intact colon during late inflammation in interleukin-10 gene deficient mice
Abstract
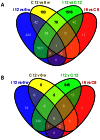
In addition to their role in absorption and secretion, epithelial cells play an important role in the protection of the colon mucosa from the resident microbiota and are important for the maintenance of homeostasis. Microarray analysis of intact colon samples is widely used to gain an overview of the cellular pathways and processes that are active in the colon during inflammation. Laser microdissection of colon epithelial cells allows a more targeted analysis of molecular pathways in the mucosa, preceding and during inflammation, with potentially increased sensitivity to changes in specific cell populations. The aim of this study was to investigate the molecular changes that occur in early and late inflammation stages in colon epithelium of a mouse model of inflammatory bowel diseases. Microarray analysis of intact colon samples and microdissected colon epithelial cell samples from interleukin-10 gene deficient and control mice at 6 and 12 weeks of age was undertaken. Results of gene set enrichment analysis showed that more immune-related pathways were identified between interleukin-10 gene deficient and control mice at 6 weeks of age in epithelial cells than intact colon. This suggests that targeting epithelial cells could increase sensitivity for detecting immune changes that occur early in the inflammatory process. However, in the later stages of inflammation, microarray analyses of intact colon and epithelium both provide a similar overview of gene expression changes in the colon mucosa at the pathway level.
Conflict of interest statement
Figures


Similar articles
-
Mast cell deficiency exacerbates inflammatory bowel symptoms in interleukin-10-deficient mice.World J Gastroenterol. 2014 Jul 21;20(27):9106-15. doi: 10.3748/wjg.v20.i27.9106. World J Gastroenterol. 2014. PMID: 25083083 Free PMC article.
-
Development, validation and implementation of an in vitro model for the study of metabolic and immune function in normal and inflamed human colonic epithelium.Dan Med J. 2015 Jan;62(1):B4973. Dan Med J. 2015. PMID: 25557335 Review.
-
Changes in colon gene expression associated with increased colon inflammation in interleukin-10 gene-deficient mice inoculated with Enterococcus species.BMC Immunol. 2010 Jul 15;11:39. doi: 10.1186/1471-2172-11-39. BMC Immunol. 2010. PMID: 20630110 Free PMC article.
-
Elevated lipopolysaccharide in the colon evokes intestinal inflammation, aggravated in immune modulator-impaired mice.Am J Physiol Gastrointest Liver Physiol. 2012 Aug 15;303(4):G490-7. doi: 10.1152/ajpgi.00120.2012. Epub 2012 Jun 21. Am J Physiol Gastrointest Liver Physiol. 2012. PMID: 22723263 Free PMC article.
-
The intestinal barrier, an arbitrator turned provocateur in IBD.Nat Rev Gastroenterol Hepatol. 2021 Feb;18(2):83-84. doi: 10.1038/s41575-020-00399-w. Nat Rev Gastroenterol Hepatol. 2021. PMID: 33318680 Review. No abstract available.
Cited by
-
Epithelial RABGEF1 deficiency promotes intestinal inflammation by dysregulating intrinsic MYD88-dependent innate signaling.Mucosal Immunol. 2020 Jan;13(1):96-109. doi: 10.1038/s41385-019-0211-z. Epub 2019 Oct 18. Mucosal Immunol. 2020. PMID: 31628426
-
Quality of methods reporting in animal models of colitis.Inflamm Bowel Dis. 2015 Jun;21(6):1248-59. doi: 10.1097/MIB.0000000000000369. Inflamm Bowel Dis. 2015. PMID: 25989337 Free PMC article.
-
Inoculation with enterococci does not affect colon inflammation in the multi-drug resistance 1a-deficient mouse model of IBD.BMC Gastroenterol. 2016 Mar 3;16:31. doi: 10.1186/s12876-016-0447-y. BMC Gastroenterol. 2016. PMID: 26940566 Free PMC article.
-
Changes in composition of caecal microbiota associated with increased colon inflammation in interleukin-10 gene-deficient mice inoculated with Enterococcus species.Nutrients. 2015 Mar 11;7(3):1798-816. doi: 10.3390/nu7031798. Nutrients. 2015. PMID: 25768951 Free PMC article.
-
Obesity, rather than diet, drives epigenomic alterations in colonic epithelium resembling cancer progression.Cell Metab. 2014 Apr 1;19(4):702-11. doi: 10.1016/j.cmet.2014.03.012. Cell Metab. 2014. PMID: 24703701 Free PMC article.
References
-
- Espina V, Wulfkuhle JD, Calvert VS, VanMeter A, Zhou W, et al. (2006) Laser-capture microdissection. Nat Protoc 1: 586–603. - PubMed
-
- Hooper LV (2004) Laser microdissection: exploring host-bacterial encounters at the front lines. Curr Opin Microbiol 7: 290–295. - PubMed
-
- Walch A, Specht K, Smida J, Aubele M, Zitzelsberger H, et al. (2001) Tissue microdissection techniques in quantitative genome and gene expression analyses. Histochem Cell Biol 115: 269–276. - PubMed
Publication types
MeSH terms
Substances
LinkOut - more resources
Full Text Sources
Other Literature Sources
Molecular Biology Databases

