Hematopoietic sphingosine 1-phosphate lyase deficiency decreases atherosclerotic lesion development in LDL-receptor deficient mice
- PMID: 23700419
- PMCID: PMC3659045
- DOI: 10.1371/journal.pone.0063360
Hematopoietic sphingosine 1-phosphate lyase deficiency decreases atherosclerotic lesion development in LDL-receptor deficient mice
Abstract
Aims: Altered sphingosine 1-phosphate (S1P) homeostasis and signaling is implicated in various inflammatory diseases including atherosclerosis. As S1P levels are tightly controlled by S1P lyase, we investigated the impact of hematopoietic S1P lyase (Sgpl1(-/-)) deficiency on leukocyte subsets relevant to atherosclerosis.
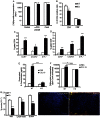
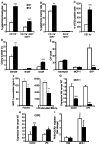
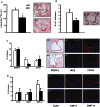
Methods and results: LDL receptor deficient mice that were transplanted with Sgpl1(-/-) bone marrow showed disrupted S1P gradients translating into lymphopenia and abrogated lymphocyte mitogenic and cytokine response as compared to controls. Remarkably however, Sgpl1(-/-) chimeras displayed mild monocytosis, due to impeded stromal retention and myelopoiesis, and plasma cytokine and macrophage expression patterns, that were largely compatible with classical macrophage activation. Collectively these two phenotypic features of Sgpl1 deficiency culminated in diminished atherogenic response.
Conclusions: Here we not only firmly establish the critical role of hematopoietic S1P lyase in controlling S1P levels and T cell trafficking in blood and lymphoid tissue, but also identify leukocyte Sgpl1 as critical factor in monocyte macrophage differentiation and function. Its, partly counterbalancing, pro- and anti-inflammatory activity spectrum imply that intervention in S1P lyase function in inflammatory disorders such as atherosclerosis should be considered with caution.
Conflict of interest statement
Figures


Similar articles
-
Elevating Endogenous Sphingosine-1-Phosphate (S1P) Levels Improves Endothelial Function and Ameliorates Atherosclerosis in Low Density Lipoprotein Receptor-Deficient (LDL-R-/-) Mice.Thromb Haemost. 2018 Aug;118(8):1470-1480. doi: 10.1055/s-0038-1666870. Epub 2018 Jul 30. Thromb Haemost. 2018. PMID: 30060257
-
Sphingosine-1-phosphate lyase deficiency produces a pro-inflammatory response while impairing neutrophil trafficking.J Biol Chem. 2011 Mar 4;286(9):7348-58. doi: 10.1074/jbc.M110.171819. Epub 2010 Dec 20. J Biol Chem. 2011. PMID: 21173151 Free PMC article.
-
KRP-203, sphingosine 1-phosphate receptor type 1 agonist, ameliorates atherosclerosis in LDL-R-/- mice.Arterioscler Thromb Vasc Biol. 2013 Jul;33(7):1505-12. doi: 10.1161/ATVBAHA.113.301347. Epub 2013 May 2. Arterioscler Thromb Vasc Biol. 2013. PMID: 23640484
-
Epigenetic regulation of pro-inflammatory cytokine secretion by sphingosine 1-phosphate (S1P) in acute lung injury: Role of S1P lyase.Adv Biol Regul. 2017 Jan;63:156-166. doi: 10.1016/j.jbior.2016.09.007. Epub 2016 Sep 29. Adv Biol Regul. 2017. PMID: 27720306 Free PMC article. Review.
-
Sphingosine phosphate lyase insufficiency syndrome (SPLIS): A novel inborn error of sphingolipid metabolism.Adv Biol Regul. 2019 Jan;71:128-140. doi: 10.1016/j.jbior.2018.09.004. Epub 2018 Sep 25. Adv Biol Regul. 2019. PMID: 30274713 Free PMC article. Review.
Cited by
-
Sphingosine-1-Phosphate Signaling in Endothelial Disorders.Curr Atheroscler Rep. 2016 Jun;18(6):31. doi: 10.1007/s11883-016-0586-1. Curr Atheroscler Rep. 2016. PMID: 27115142 Review.
-
Lysophospholipids and their G protein-coupled receptors in atherosclerosis.Front Biosci (Landmark Ed). 2016 Jan 1;21(1):70-88. doi: 10.2741/4377. Front Biosci (Landmark Ed). 2016. PMID: 26594106 Free PMC article.
-
Sphingosine-1-Phosphate Signaling in Immune Cells and Inflammation: Roles and Therapeutic Potential.Mediators Inflamm. 2016;2016:8606878. doi: 10.1155/2016/8606878. Epub 2016 Feb 7. Mediators Inflamm. 2016. PMID: 26966342 Free PMC article. Review.
-
Implication of sphingosin-1-phosphate in cardiovascular regulation.Front Biosci (Landmark Ed). 2016 Jun 1;21(7):1296-313. doi: 10.2741/4458. Front Biosci (Landmark Ed). 2016. PMID: 27100508 Free PMC article. Review.
-
Interaction between lipid metabolism and macrophage polarization in atherosclerosis.iScience. 2025 Mar 7;28(4):112168. doi: 10.1016/j.isci.2025.112168. eCollection 2025 Apr 18. iScience. 2025. PMID: 40201117 Free PMC article. Review.
References
-
- Spiegel S, Milstien S (2003) Sphingosine-1-phosphate: an enigmatic signaling lipid. Nat Rev Mol Cell Biol 4: 397–407. - PubMed
-
- Gardell SE, Dubin AE (2006) Chun J Emerging medicinal roles for lysophospholipid signaling. Trends Mol Med 12: 65–75. - PubMed
-
- Yatomi Y, Ohmori T, Rile G, Kazama F, Okamoto H, et al. (2000) Sphingosine 1-phosphate as a major bioactive lysophospholipid that is released from platelets and interacts with endothelial cells. Blood 96: 3431–3438. - PubMed
-
- Hänel P, Andréani P, Gräler MH (2007) Erythrocytes store and release sphingosine 1-phosphate in blood. FASEB J 21: 1202–1209. - PubMed
Publication types
MeSH terms
Substances
Grants and funding
LinkOut - more resources
Full Text Sources
Other Literature Sources
Medical
Molecular Biology Databases
Research Materials

