Role of adipose and hepatic atypical protein kinase C lambda (PKCλ) in the development of obesity and glucose intolerance
- PMID: 23700535
- PMCID: PMC3609106
- DOI: 10.4161/adip.20891
Role of adipose and hepatic atypical protein kinase C lambda (PKCλ) in the development of obesity and glucose intolerance
Abstract
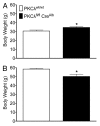
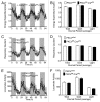
PKCλ, an atypical member of the multifunctional protein kinase C family, has been implicated in the regulation of insulin-stimulated glucose transport and of the intracellular immune response. To further elucidate the role of this cellular regulator in diet-induced obesity and insulin resistance, we generated both liver (PKC-Alb) and adipose tissue (PKC-Ap2) specific knockout mice. Body weight, fat mass, food intake, glucose homeostasis and energy expenditure were evaluated in mice maintained on either chow or high fat diet (HFD). Ablation of PKCλ from the adipose tissue resulted in mice that were indistinguishable from their wild-type littermates. However, PKC-Alb mice were resistant to diet-induced obesity (DIO). Surprisingly this DIO resistance was not associated with either a reduction in caloric intake or an increase in energy expenditure as compared with their wild-type littermates. Furthermore, these mice displayed an improvement in glucose tolerance. When maintained on chow diet, these mice were similar to wild types in respect to body weight and fat mass, yet insulin sensitivity was impaired compared with wt littermates. Taken together these data suggest that hepatic PKCλ is modulating insulin-mediated glucose turnover and response to high fat diet feeding, thus offering a deeper understanding of an important target for anti-obesity therapeutics.
Keywords: atypical protein kinase C-lambda; diet induced obesity; energy expenditure; glucose tolerance; insulin resistance.
Figures


Similar articles
-
TNP [N2-(m-Trifluorobenzyl), N6-(p-nitrobenzyl)purine] ameliorates diet induced obesity and insulin resistance via inhibition of the IP6K1 pathway.Mol Metab. 2016 Aug 21;5(10):903-917. doi: 10.1016/j.molmet.2016.08.008. eCollection 2016 Oct. Mol Metab. 2016. PMID: 27689003 Free PMC article.
-
AHNAK KO mice are protected from diet-induced obesity but are glucose intolerant.Horm Metab Res. 2015 Apr;47(4):265-72. doi: 10.1055/s-0034-1387736. Epub 2014 Aug 25. Horm Metab Res. 2015. PMID: 25153686
-
Insulin-stimulated protein kinase C lambda/zeta activity is reduced in skeletal muscle of humans with obesity and type 2 diabetes: reversal with weight reduction.Diabetes. 2003 Aug;52(8):1935-42. doi: 10.2337/diabetes.52.8.1935. Diabetes. 2003. PMID: 12882908
-
Selective inactivation of c-Jun NH2-terminal kinase in adipose tissue protects against diet-induced obesity and improves insulin sensitivity in both liver and skeletal muscle in mice.Diabetes. 2011 Feb;60(2):486-95. doi: 10.2337/db10-0650. Diabetes. 2011. PMID: 21270260 Free PMC article.
-
Emerging role of protein kinase C in energy homeostasis: A brief overview.World J Diabetes. 2014 Jun 15;5(3):385-92. doi: 10.4239/wjd.v5.i3.385. World J Diabetes. 2014. PMID: 24936260 Free PMC article. Review.
Cited by
-
The Dual Roles of the Atypical Protein Kinase Cs in Cancer.Cancer Cell. 2019 Sep 16;36(3):218-235. doi: 10.1016/j.ccell.2019.07.010. Epub 2019 Aug 29. Cancer Cell. 2019. PMID: 31474570 Free PMC article. Review.
-
TGF-β receptor 1 regulates progenitors that promote browning of white fat.Mol Metab. 2018 Oct;16:160-171. doi: 10.1016/j.molmet.2018.07.008. Epub 2018 Jul 27. Mol Metab. 2018. PMID: 30100246 Free PMC article.
-
Circulating HDL levels control hypothalamic astrogliosis via apoA-I.J Lipid Res. 2018 Sep;59(9):1649-1659. doi: 10.1194/jlr.M085456. Epub 2018 Jul 10. J Lipid Res. 2018. PMID: 29991652 Free PMC article.
-
Deletion of Protein Kinase C λ in POMC Neurons Predisposes to Diet-Induced Obesity.Diabetes. 2017 Apr;66(4):920-934. doi: 10.2337/db16-0482. Epub 2017 Jan 10. Diabetes. 2017. PMID: 28073831 Free PMC article.
-
Impairment of insulin-stimulated glucose transport and ERK activation by adipocyte-specific knockout of PKC-λ produces a phenotype characterized by diminished adiposity and enhanced insulin suppression of hepatic gluconeogenesis.Adipocyte. 2014 Jan 1;3(1):19-29. doi: 10.4161/adip.26305. Epub 2013 Sep 10. Adipocyte. 2014. PMID: 24575365 Free PMC article.
References
Grants and funding
LinkOut - more resources
Full Text Sources
Research Materials
Miscellaneous
