. 2012 Oct 1;1(4):215-229.
doi: 10.4161/adip.21496.

Adipose lineage specification of bone marrow-derived myeloid cells

Affiliations

Adipose lineage specification of bone marrow-derived myeloid cells

Susan M Majka et al. Adipocyte. .

Abstract

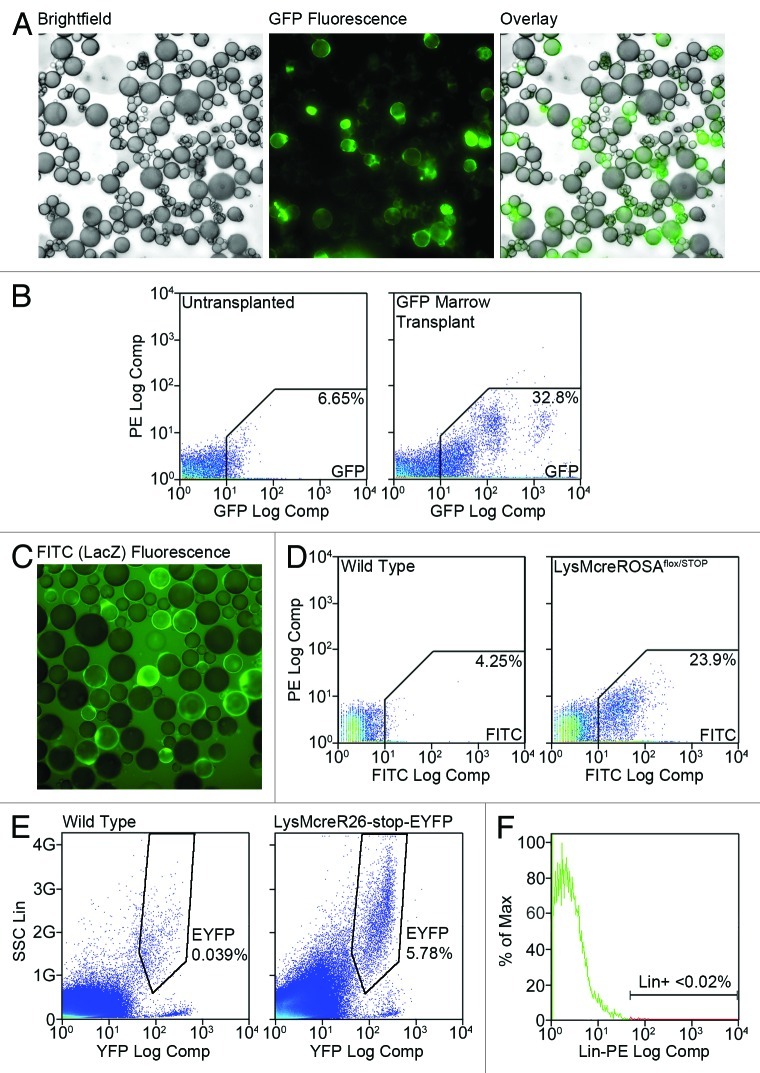
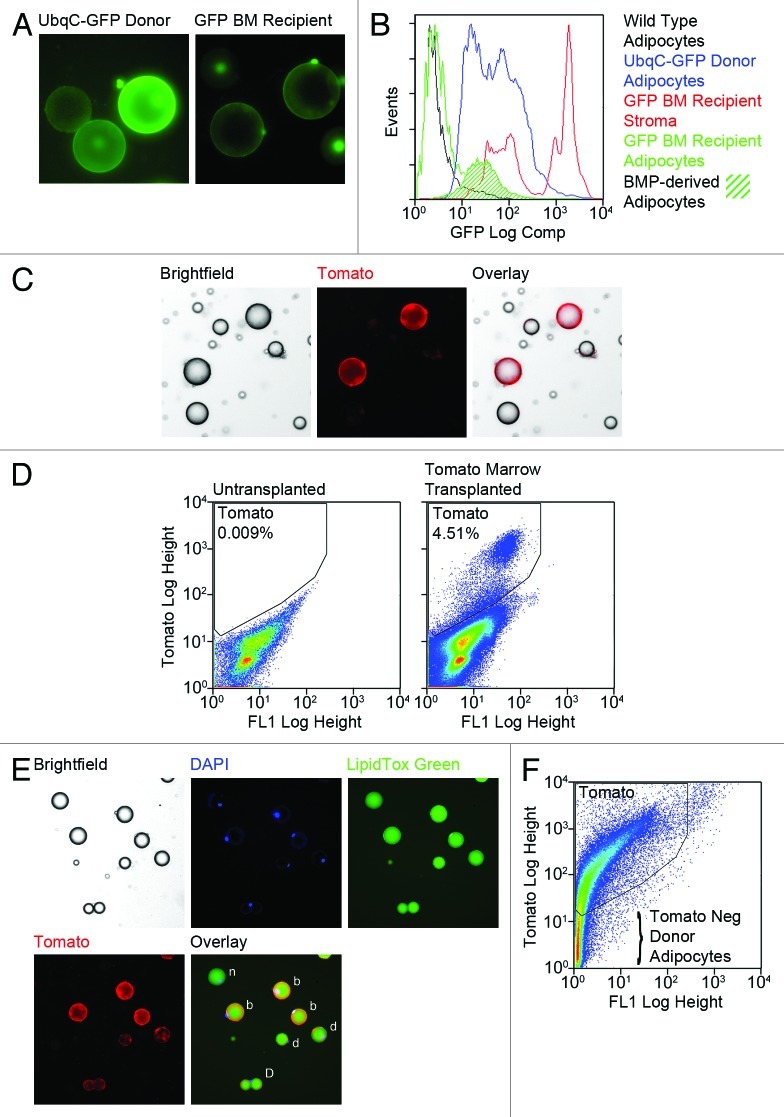
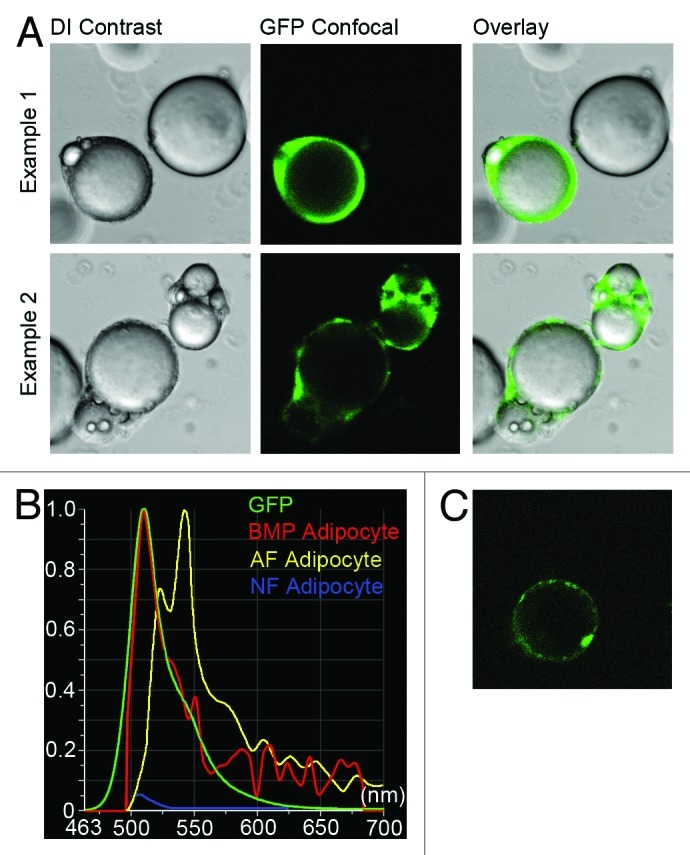
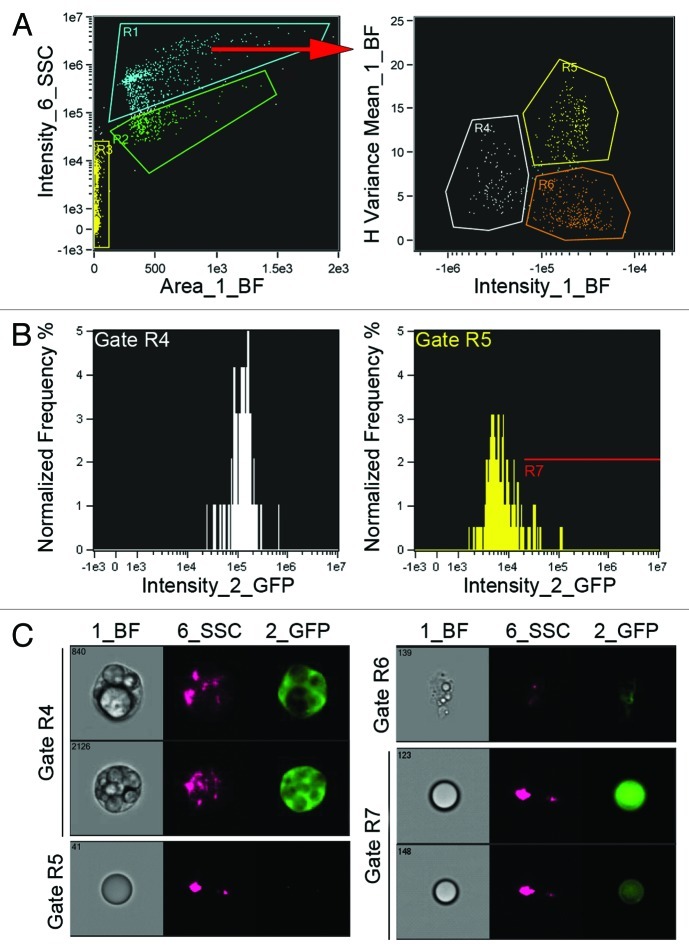
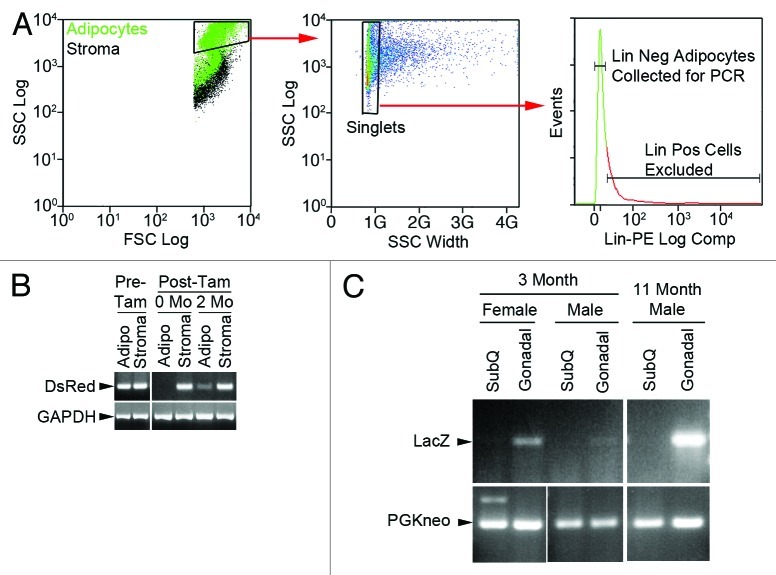
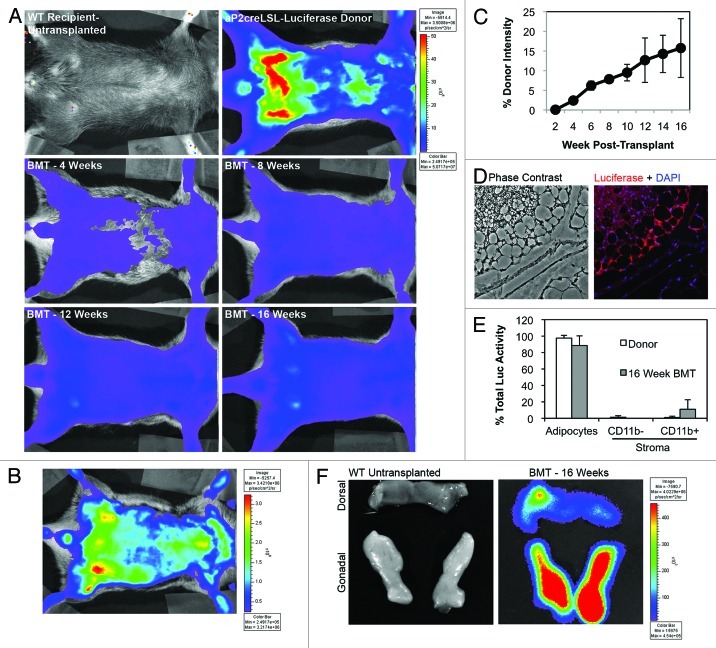
We have reported the production of white adipocytes in adipose tissue from hematopoietic progenitors arising from bone marrow. However, technical challenges have hindered detection of this adipocyte population by certain other laboratories. These disparate results highlight the need for sensitive and definitive techniques to identify bone marrow progenitor (BMP)-derived adipocytes. In these studies we exploited new models and methods to enhance detection of this adipocyte population. Here we showed that confocal microscopy with spectrum acquisition could effectively identify green fluorescent protein (GFP) positive BMP-derived adipocytes by matching their fluorescence spectrum to that of native GFP. Likewise, imaging flow cytometry made it possible to visualize intact unilocular and multilocular GFP-positive BMP-derived adipocytes and distinguished them from non-fluorescent adipocytes and cell debris in the cytometer flow stream. We also devised a strategy to detect marker genes in flow-enriched adipocytes from which stromal cells were excluded. This technique also proved to be an efficient means for detecting genetically labeled adipocytes and should be applicable to models in which marker gene expression is low or absent. Finally, in vivo imaging of mice transplanted with BM from adipocyte-targeted luciferase donors showed a time-dependent increase in luciferase activity, with the bulk of luciferase activity confined to adipocytes rather than stromal cells. These results confirmed and extended our previous reports and provided proof-of-principle for sensitive techniques and models for detection and study of these unique cells.

Keywords: adipocyte; bone marrow; confocal microscopy; imaging flow cytometry; in vivo imaging; progenitor cell; spectral analysis.


Figures

None
Figure 1. Adipocytes are generated from BM progenitors. (A) Gonadal fat was recovered from female mice transplanted with GFP-expressing BM 16 weeks post-transplant. The fat was digested with collagenase and adipocytes were separated from stromal cells by flotation/centrifugation. (A) Representative brightfield and GFP fluorescence images of free-floating adipocytes are shown along with a digital overlay. (B) Gonadal adipocytes were prepared as in (A) from untransplanted and GFP marrow transplanted mice and analyzed by flow cytometry. Representative scattergrams are shown and the average percentages of all events falling in the GFP gate are indicated. (C) Gonadal fat was harvested from 16-week-old female LysMcreROSAflox/STOP mice. Following tissue digestion and cell separation, adipocytes were stained with FDG and examined by fluorescence microscopy. A representative fluorescence image is shown. (D) Gonadal adipocytes from wild type and LysMcreROSAflox/STOP mice were analyzed by flow cytometry. Representative scattergrams are shown and the average percentages of all events falling in the FITC gates are indicated. (E) Gonadal adipocytes from 4- to 6-week-old wild type and LysMcreR26-stop-EYFP mice were analyzed by flow cytometry. Representative scattergrams are shown and the average percentages of all events falling in the EYFP gates are indicated. (F) Gonadal adipocytes from 16 week GFP BM transplant recipients were stained with a cocktail of PE-conjugated antibodies to stromal lineage markers and analyzed by flow cytometry. Figure shows a representative histogram indicating the average percentage of lineage positive stroma cells in the adipocyte fractions.
None
Figure 2. Fluorescent marker expression can be highly variegated in adipocytes. (A) Gonadal fat was harvested from UbqC-GFP donor mice and 16 week GFP BM transplant recipients. Fat was digested with collagenase and adipocytes isolated by flotation/centrifugation. Adipocytes from both sets of animals were examined by fluorescence microscopy. Representative images taken with the same exposure parameters demonstrate variegated GFP expression in marrow donors and generally low GFP expression in BMP-derived adipocytes. (B) Gonadal fat was harvested from wild type mice, UbqC-GFP donor mice and GFP BM recipients. Adipocytes and stroma were prepared from the fat as in (A) and analyzed by flow cytometry. The figure shows representative histograms of GFP fluorescence in each sample and confirms variegated GFP expression in donor mice and dim GFP fluorescence in BMP-derived adipocytes. (C) Wild-type female mice were transplanted with BM from mT/mG donor mice. Eight weeks post-transplant, gonadal adipose tissue was harvested, digested and free-floating adipocytes separated from stromal cells. Adipocytes were examined by brightfield and fluorescence microscopy and representative images of tdTomato positive BMP-derived adipocytes among non-fluorescent fat cells are shown. (D) Gonadal adipocytes from Tomato BM transplant recipient mice and untransplanted control mice were examined by flow cytometry. Representative flow scattergrams confirm production of Tomato-expressing BMP-derived adipocytes. (E and F) Gonadal fat from mT/mG donor mice was harvested, digested and free-floating adipocytes examined by fluorescence microscopy (E) and flow cytometry (F). (E) Prior to microscopy, adipocytes were fixed briefly with 4% paraformaldehyde in PBS, then stained with LipidTOX Green for 20 min and DAPI for 10 min. Representative bright field and fluorescence images show single nuclei associated with lipid droplets. Intact cells with bright (b), dim (d) or no (n) Tomato fluorescence are indicated. (F) Representative flow scattergram shows that a considerable number of donor adipocytes are Tomato negative while the remaining adipocytes express variable levels of tdTomato.
None
Figure 3. Adipocytes isolated by collagenase digestion are intact and metabolically active. Gondal adipose tissue was harvested from female mice and digested with collagenase. Adipocytes were separated from stromal cells by flotation and centrifugation. A portion of the free-floating adipocytes were stained with dihydroethidium (DHE). Over 99% of the stained cells exhibited red fluorescence indicating the presence of a nucleus and mitochondrial activity.
None
Figure 4. Confocal microscopy and spectral detection of GFP-positive BMP-derived adipocytes. Wild type female mice were transplanted with BM from UbqC-GFP donors. Eight weeks post-transplant, gonadal fat was recovered from the recipients, digested with collagenase and adipocytes isolated by flotation/centrifugation. Free-floating adipocytes were examined by differential interference contrast and confocal microscopy. (A) Representative DIC and GFP confocal images and digital overlays show adipocytes with cytosolic GFP fluorescence adjacent to non-fluorescent fat cells. (B) Fluorescence spectrum of a BMP-derived adipocyte [shown in (C)] was acquired at 6 nm resolution from 490–683 nm. Graph shows comparison of BMP-derived adipocyte fluorescence spectrum to the spectrum of native GFP protein. (C) Image of BMP-derived adipocyte after unmixing of the GFP signal shows GFP fluorescence in the cytosol surrounding the lipid droplet.
None
Figure 5. Imaging flow cytometry of BMP-derived adipocytes. Gonadal adipose tissue was harvested from mice transplanted with BM from UbqC-GFP mice 8 weeks post-transplant. Adipocytes were isolated from collagenase-digested tissue and fixed for 20 min. in PBS containing 4% paraformaldehyde. Cells were then transferred to PBS and shipped overnight to Amnis Corp. for imaging cytometry. Adipocytes from untransplanted mice were included as negative controls and for gating. Data was acquired on an ImageStream X cytometer for brightfield (BF), side scatter (SSC) and GFP fluorescence. (A) Gating parameters were determined post-hoc by IDEAS software with preliminary gating separating intact cells (R1) from cell debris (R2) and synchronization beads (R3). Further gating of R1 revealed 3 populations; green fluorescent multilocular cells (R4), non-fluorescent unilocular cells (R5) and debris with variable fluorescence (R6). (B) The fluorescence intensity distribution of the populations in R4 and R5 are shown in the histograms. Events in R5 with fluorescence levels overlapping events in R4 were designated gate R7, which contained unilocular adipocytes with generally dim GFP expression. (C) Representative BF, SSC and GFP images for events in gates R4-R7.
None
Figure 6. PCR-based strategy to detect BMP-derived adipocytes among adipocytes purified by flow sorting. Gonadal adipose tissue was harvested from aP2cremT/mG mice prior to, immediately after and 2 mo after tamoxifen exposure. The fat was digested with collagenase and separated into adipocyte and stromal fractions. Adipocytes were stained with a cocktail of PE-conjugated antibodies to stromal lineage markers and flow sorted to remove stromal contaminants. (A) Gating strategy to remove stromal cells from adipocytes. Left panel shows adipocyte FSC vs SSC distribution overlayed on stromal distribution. Adipocytes with FSC/SSC greater than stromal cells were subjected to singlet discrimination (middle panel) to exclude cell clusters. Lineage positive events were excluded from lineage negative adipocytes as shown in the histogram (right panel). (B) The sorting strategy was validated by PCR analysis of DsRed and GAPDH genes in the adipocyte and stromal fractions. Tam, tamoxifen. No DsRed was detected in flow sorted adipocytes immediately following tamoxifen treatment indicating no significant stromal contamination. (C) The PCR strategy was used to assess BMP-derived adipocyte production in gonadal and subcutaneous (SubQ) fat from male and female LysMcreROSAflox/STOP mice at 3 and 11 mo. Primers sets were created to distinguish the spliced LacZ gene in BMP-derived adipocytes vs. the intact PGKneo gene in conventional adipocytes. Analysis indicates higher numbers of BMP-derived adipocytes in gonadal vs. subcutaneous adipose tissue and in female vs. male subjects. Comparison of the 3 and 11 mo male samples demonstrates increasing BMP-derived adipocytes in gonadal fat over time.
None
Figure 7. In vivo imaging detects BMP-derived adipocyte production in live mice over time. Eight week female wild type mice were transplanted with BM from mice in which luciferase expression was targeted to adipocytes (aP2creR26LSLLuciferase). At two week intervals post-transplant luciferase activity (light emission) was measured in the recipients in an IVIS Imaging System 50 and data was acquired and analyzed with Living Image 3.0 software. (A) Representative luminescence images of untransplanted control, luciferase BM donor and BMT recipients at 4, 8, 12 and 16 weeks post-transplant. All images are at the same scale. (B) Luminescence measured in a BMT recipient mouse 16 weeks post-transplant. Scale is expanded to emphasize distribution and localization of the luminescence signal. (C) Average (n = 4) maximal luminescence vs. time measured in the region above the gonadal fat pads as a percentage of the maximal signal measured in BM donors. (D) Gonadal fat from a mouse transplanted with BM from an aP2creLSL-Luciferase donor was harvested 16 weeks post-transplant. Tissue was fixed, embedded, sectioned and immunohistochemistry was performed with anti-luciferase antibodies. Representative phase contrast and fluorescence overlay (red, luciferase; blue, DAPI) images are shown. (E) Gonadal adipose tissue was harvested from BM donors and transplant recipients and digested with collagenase. Adipocytes and stromal cells were separated by flotation/centrifugation and stroma was further separated into CD11b positive and negative fractions with antibody-conjugated magnetic beads. Cells were lysed and luciferase activity measured in a Turner Biosystems 20/20 luminometer. Luciferase activity in each fraction is shown as a percentage of total activity in each depot (n = 6). (F) Untransplanted and BM transplanted animals were injected with luciferin and gonadal and dorsal fat pads were harvested. Luminescence of the fat pads was measured in the IVIS 50 imager and is shown on the same scale.

Similar articles

Cited by

References

    1. Bahceci M, Gokalp D, Bahceci S, Tuzcu A, Atmaca S, Arikan S. The correlation between adiposity and adiponectin, tumor necrosis factor alpha, interleukin-6 and high sensitivity C-reactive protein levels. Is adipocyte size associated with inflammation in adults? J Endocrinol Invest. 2007;30:210–4. - PubMed
    1. Engfeldt P, Arner P. Lipolysis in human adipocytes, effects of cell size, age and of regional differences. Horm Metab Res Suppl. 1988;19:26–9. - PubMed
    1. Bays HE, González-Campoy JM, Bray GA, Kitabchi AE, Bergman DA, Schorr AB, et al. Pathogenic potential of adipose tissue and metabolic consequences of adipocyte hypertrophy and increased visceral adiposity. Expert Rev Cardiovasc Ther. 2008;6:343–68. doi: 10.1586/14779072.6.3.343. - DOI - PubMed
    1. Després JP. Is visceral obesity the cause of the metabolic syndrome? Ann Med. 2006;38:52–63. doi: 10.1080/07853890500383895. - DOI - PubMed
    1. Wajchenberg BL, Giannella-Neto D, da Silva MER, Santos RF. Depot-specific hormonal characteristics of subcutaneous and visceral adipose tissue and their relation to the metabolic syndrome. Horm Metab Res. 2002;34:616–21. doi: 10.1055/s-2002-38256. - DOI - PubMed

LinkOut - more resources