. 2013 Aug:61:133-141.
doi: 10.1016/j.yjmcc.2013.05.006. Epub 2013 May 20.

Distribution and function of sodium channel subtypes in human atrial myocardium

Affiliations

Distribution and function of sodium channel subtypes in human atrial myocardium

Susann G Kaufmann et al. J Mol Cell Cardiol. 2013 Aug.

Abstract

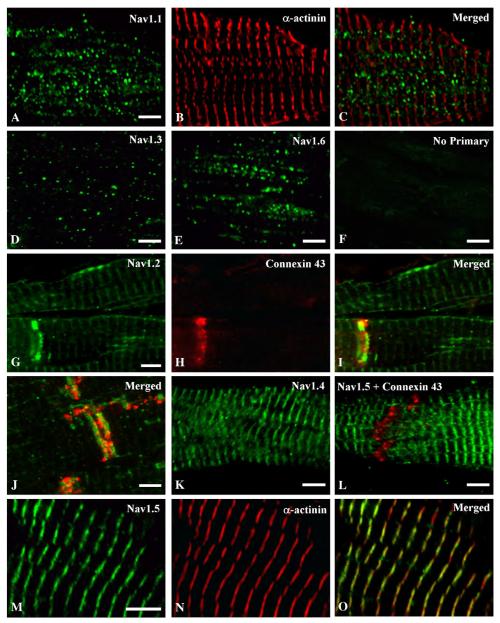
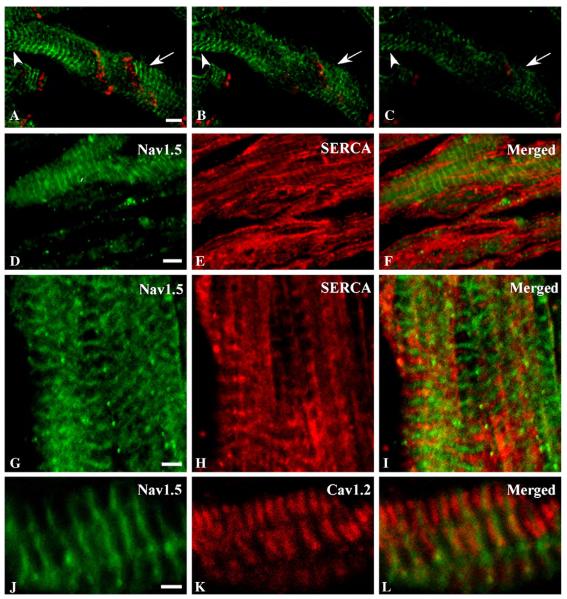
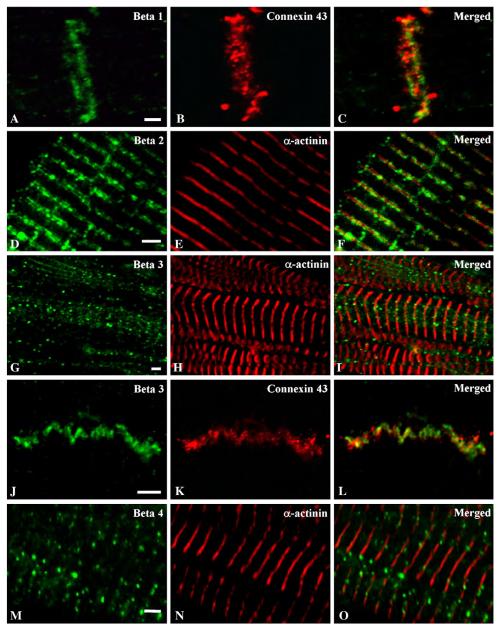
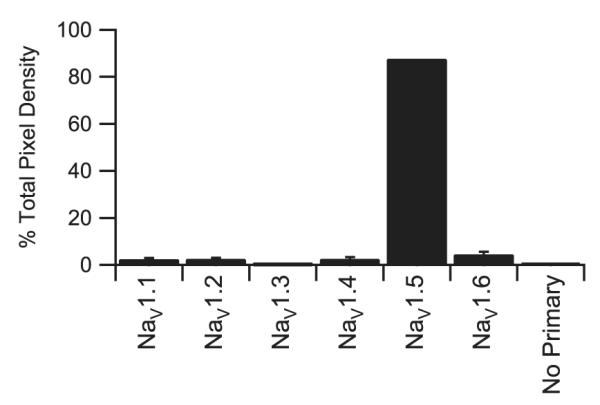
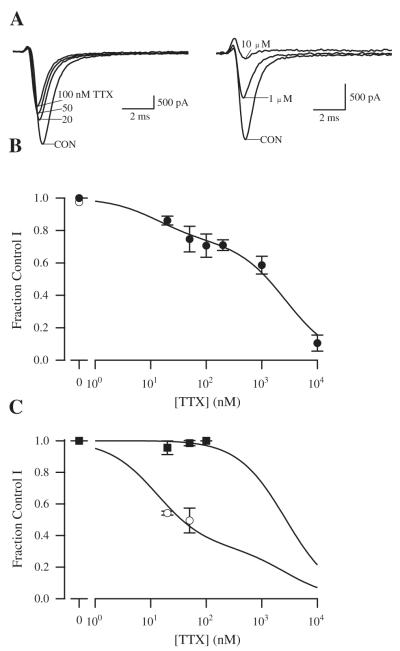
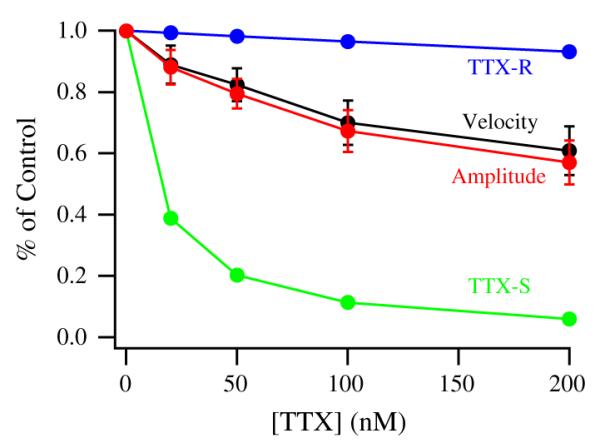
Voltage-gated sodium channels composed of a pore-forming α subunit and auxiliary β subunits are responsible for the upstroke of the action potential in cardiac muscle. However, their localization and expression patterns in human myocardium have not yet been clearly defined. We used immunohistochemical methods to define the level of expression and the subcellular localization of sodium channel α and β subunits in human atrial myocytes. Nav1.2 channels are located in highest density at intercalated disks where β1 and β3 subunits are also expressed. Nav1.4 and the predominant Nav1.5 channels are located in a striated pattern on the cell surface at the z-lines together with β2 subunits. Nav1.1, Nav1.3, and Nav1.6 channels are located in scattered puncta on the cell surface in a pattern similar to β3 and β4 subunits. Nav1.5 comprised approximately 88% of the total sodium channel staining, as assessed by quantitative immunohistochemistry. Functional studies using whole cell patch-clamp recording and measurements of contractility in human atrial cells and tissue showed that TTX-sensitive (non-Nav1.5) α subunit isoforms account for up to 27% of total sodium current in human atrium and are required for maximal contractility. Overall, our results show that multiple sodium channel α and β subunits are differentially localized in subcellular compartments in human atrial myocytes, suggesting that they play distinct roles in initiation and conduction of the action potential and in excitation-contraction coupling. TTX-sensitive sodium channel isoforms, even though expressed at low levels relative to TTX-sensitive Nav1.5, contribute substantially to total cardiac sodium current and are required for normal contractility. This article is part of a Special Issue entitled "Na(+) Regulation in Cardiac Myocytes".

Keywords: Contractility; Immunocytochemistry; Myocardium; Sodium channels.


Figures

Fig. 1
Fig. 1
Immunostaining of sodium channel α subunits Nav1.1, 1.3, 1.6, 1.2, 1.4 and 1.5 in human atrium. Tissue section double-labelled with anti-Nav1.1 (A) and α actinin (B) demonstrating punctate surface labelling of Nav1.1 channels that does not overlap with the z-lines when the images are merged (C). Human atrial tissue labelled with anti-Nav1.3 (D) or anti-Nav1.6 (E) illustrating punctate surface staining of these channels, similar to anti-Nav1.1. (F) Control section in which the primary antibody was omitted illustrating specificity of staining. Tissue section double labelled with anti-Nav1.2 (G) and anti-connexin 43 (H) illustrating a high density of Nav1.2 channels at the intercalated disk region (I, merged) and relatively low density of staining in a banded pattern along the length of the myocyte. (J) Higher magnification of a tissue section double labelled with anti-Nav1.2 (green) and anti-connexin 43 (red) illustrating the staining of these two proteins at the intercalated disk region. (K) Staining of anti-Nav1.4 on atrial tissue illustrating staining in a banded pattern along the myocyte. (L) Atrial tissue double-labelled with anti-Nav1.5 (green) and anti-connexin 43 (red). (M, N) High magnification image of tissue double-labelled with anti-Nav1.5 (M) and α-actinin (N) showing that the banded pattern of Nav1.5 staining is in register with the staining of α-actinin at the z-lines (O). Scale bars = 5 μm.
Fig. 2
Fig. 2
Localization of Nav1.5 relative to SERCA ATPase and CaV1.2. (A–C) Images from a z-series through atrial tissue stained with anti-Nav1.5 (green) and anti-connexin 43 at the cell surface (A) and progressively deeper sections (B and C) to confirm surface localization of sodium channel proteins. Arrows and arrowheads emphasize locations where depth-dependent changes in staining are particularly evident. (D–F) Optical plane showing both cell surface and intracellular staining for Nav1.5 (green, D and F) and SERCA ATPase (red). (G–I) Distribution of Nav1.5 (green, G, I) relative to SERCA ATPase (red, H, I). J–L, Localization of Nav1.5 (green, J, L) relative to CaV1.2 (red, K, L). Scale bars A–F = 5 μm; G–L = 2 μm.
Fig. 3
Fig. 3
Double immunostaining of sodium channel β subunits in human atrium with connexin 43 and α-actinin. Tissue section double labelled with anti-β1 (A) and anti-connexin 43 (B) antibodies illustrating dense labelling at the region of the intercalated disk of atrial tissue. (C) Merged picture of images in (A) and (B). Section double labelled with anti-β2 (D) and α-actinin (E) illustrating labelling of the β2 subunit of sodium channels in a banded pattern in register with the z-lines when the images are merged (F). (G) Atrial tissue double labelled with anti-β3 (G) and α-actinin (H) showing non-uniform, punctate staining in muscle fiber when the images are merged (I). Tissue section labelled with anti-β3 (J) and anti-connexin 43 (K) illustrating that β3 subunits are present at the intercalated disk region as shown in the merged image (L). Double labelling of atrial section with anti-β4 (M) and anti-α actinin (N) illustrating a punctate pattern of staining that is in register with the z-lines as shown in the merged image (O). Scale bars = 2 μm.
Fig. 4
Fig. 4
Immunocytochemical quantification of TTX-sensitive sodium channel α subunit isoforms. Quantification of staining by antibodies recognizing TTX-sensitive sodium by channel α subunits Nav1.1, Nav1.2, Nav1.3, Nav1.4 or Nav1.6 as well as the TTX-resistant Nav1.5 sodium channel expressed as normalized pixel density.
Fig. 5
Fig. 5
Concentration–response relationship for the effect of TTX on total cardiac peak sodium current in human atrial myocytes. (A) Examples of current traces during treatment with TTX in two different human atrial myocytes. Depolarizations to 0 mV from a holding potential of −100 mV were applied every 5 s, and peak sodium current was measured and compared in the absence and presence of the indicated TTX concentrations. (B) Concentration–response relationship from experiments like those in A. After exposure to TTX, toxin was washed out of the bath to insure that rundown had not occurred. Reversal values are plotted as the open point at 0 concentration. Error bars represent SEM. The fit curve is a two component binding isotherm with IC50 values of 12.7 nM and 2.7 μM. The higher affinity component represents 27% of the total current. (C) Effect of holding potential and test potential on TTX inhibition. Bars display normalized currents ± SEM. Filled squares, TTX effect at a holding potential of −100 mV and a test pulse to −60 mV; open circles, TTX effect at a holding potential of −70 mV and test pulse to 0 mV. Control conditions were recorded at −100 mV holding and 0 mV test potential. All displayed data were normalized to control conditions. Fit of the two-component binding isotherm with IC50 values fixed to the values determined in panel B indicating that 67% of the channels were TTX-sensitive. Recordings were from 12 different patients with 3–30 myocytes studied per TTX concentration.
Fig. 6
Fig. 6
Concentration dependent effects of specific sodium channel blockade with TTX on human atrial contractility showing contraction amplitude (red) and velocity (black). The fractions of sodium current due to TTX-resistant (blue) and TTX-sensitive (green) channels remaining at each TTX concentration. The values were calculated from the best fit data from Fig. 5B.

References

    1. Clancy CE, Kass RS. Inherited and acquired vulnerability to ventricular arrhythmias: cardiac Na+ and K+ channels. Physiol Rev. 2005;85:33–47. - PubMed
    1. McNair WP, Ku L, Taylor MR, Fain PR, Dao D, Wolfel E, et al. SCN5A mutation associated with dilated cardiomyopathy, conduction disorder, and arrhythmia. Circulation. 2004;110:2163–7. - PubMed
    1. George AL., Jr Inherited disorders of voltage-gated sodium channels. J Clin Invest. 2005;115:1990–9. - PMC - PubMed
    1. Medeiros-Domingo A, Kaku T, Tester DJ, Iturralde-Torres P, Itty A, Ye B, et al. SCN4B-encoded sodium channel β4 subunit in congenital long-QT syndrome. Circulation. 2007;116:134–42. - PMC - PubMed
    1. Catterall WA. From ionic currents to molecular mechanisms: the structure and function of voltage-gated sodium channels. Neuron. 2000;26:13–25. - PubMed

Publication types

LinkOut - more resources