. 2013 May 23:14:340.
doi: 10.1186/1471-2164-14-340.

Insights into organ-specific pathogen defense responses in plants: RNA-seq analysis of potato tuber-Phytophthora infestans interactions

Affiliations

Insights into organ-specific pathogen defense responses in plants: RNA-seq analysis of potato tuber-Phytophthora infestans interactions

Liangliang Gao et al. BMC Genomics. .

Abstract

Background: The late blight pathogen Phytophthora infestans can attack both potato foliage and tubers. Although interaction transcriptome dynamics between potato foliage and various pathogens have been reported, no transcriptome study has focused specifically upon how potato tubers respond to pathogen infection. When inoculated with P. infestans, tubers of nontransformed 'Russet Burbank' (WT) potato develop late blight disease while those of transgenic 'Russet Burbank' line SP2211 (+RB), which expresses the potato late blight resistance gene RB (Rpi-blb1), do not. We compared transcriptome responses to P. infestans inoculation in tubers of these two lines.

Results: We demonstrated the practicality of RNA-seq to study tetraploid potato and present the first RNA-seq study of potato tuber diseases. A total of 483 million paired end Illumina RNA-seq reads were generated, representing the transcription of around 30,000 potato genes. Differentially expressed genes, gene groups and ontology bins that exhibited differences between the WT and +RB lines were identified. P. infestans transcripts, including those of known effectors, were also identified.

Conclusion: Faster and stronger activation of defense related genes, gene groups and ontology bins correlate with successful tuber resistance against P. infestans. Our results suggest that the hypersensitive response is likely a general form of resistance against the hemibiotrophic P. infestans-even in potato tubers, organs that develop below ground.


Figures
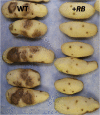
Figure 1
Figure 1
Gene RB confers enhanced tuber late blight disease resistance. Field grown tubers of nontransformed ‘Russet Burbank’ (WT) and SP2211 (+RB), a transformed ‘Russet Burbank’ line carrying the RB transgene, were mechanically wounded, inoculated with Phytophthora infestans, and incubated for 11 days under conditions that favor disease development. Tubers were peeled to allow assessment of diseased tissues. WT tubers consistently show robust tuber late blight disease development, revealed as darkened tissue radiating from inoculation sites. In contrast, +RB tubers displayed no tuber late blight disease. Note that brown spots present on +RB tubers are in response to mechanical wounding, not late blight disease; similar wound response was observed in water-inoculated tubers (not shown).
Figure 2
Figure 2
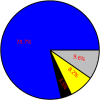
A majority of RNA-seq reads map uniquely to the potato reference genome sequence. A pie chart summarizing results of alignment of Illumina RNA-seq reads from 36 water- or P. infestans-inoculated WT and +RB tuber samples to the potato reference genome sequence. The grey portion of the chart represents RNA-seq reads that failed quality checks and were filtered out of our data set (9.6% of all RNA-seq reads). The remaining 90.4% of RNA-seq reads passed quality checks. The blue portion of the chart represents reads that mapped uniquely to the potato genome sequence (78.7% of all RNA-seq reads). The black portion of the chart represents reads that mapped to multiple locations of the potato genome sequence (3.5%). The yellow portion of the chart represents reads that failed to map to the potato genome sequence (8.2%), including <0.01% of RNA-seq reads that mapped to P. infestans transcripts.
Figure 3
Figure 3
Time and treatment have larger influences than genotype on overall transcriptome differences. FPKM (Fragment per kilobase of exon per million mapped reads) values for transcriptome sets from 36 potato tuber samples were subjected to PCA using the R statistical package [53]. Blue circles represent P. infestans-inoculated tuber samples collected at 0 hpi; green circles represent water-inoculated samples at 0 hpi; orange circles represent P. infestans-inoculated samples collected at 24 hpi; purple circles represent water-inoculated samples collected at 24 hpi; red circles represent P. infestans-inoculated samples collected at 48 hpi; black circles represent water-inoculated samples collected at 48 hpi. Circles containing dots were collected from the transgenic line SP2211 (+RB); circles without dots were collected from nontransformed ‘Russet Burbank’ (WT). Note that tuber samples collected at a similar time tend to cluster, regardless of genotype of origin.
Figure 4
Figure 4
Between time point transcriptome dynamics reveal different patterns of gene regulation in compatible and incompatible potato tuber – Phytophthora infestans interactions. MA plots (hybridization intensity plotted against the fold change in expression) displaying between time point transcriptome dynamics in nontransformed ‘Russet Burbank’ (WT) and transgenic SP2211 (+RB) lines in response to P. infestans. X-axes indicate mean gene expression levels [0.5*(log2(FPKM1)+log2(FPKM2))] across the two selected time points for each comparison. Y-axes indicate fold change values [log2(FPKM1/FPKM2), where FPKM1 represents the later time point and FPKM2 represents the earlier time point] across the selected time points. A: changes in WT transcriptome dynamics from 0 to 24 hpi; B: changes in WT transcriptome dynamics from 24 hpi to 48 hpi; C: changes in +RB transcriptome dynamics from 0 hpi to 24 hpi; D: changes in +RB transcriptome dynamics from 24 hpi to 48 hpi. Within each panel, colored dots represent genes that are significantly (FDR<0.001) differentially regulated among comparisons. Black dots represent genes that are not significantly differentially regulated. Note that the WT line shows mostly up-regulation of genes during later stages of infection (panel B) while the +RB line displays approximately equal up- and down-regulation of genes (panel D).
Figure 5
Figure 5
Hierarchical clustering of differentially expressed (DE) genes in potato tubers following inoculation with Phytophthora infestans. Tubers of nontransformed ‘Russet Burbank’ (WT) and transgenic SP2211 (+RB) were inoculated with P. infestans or water. Tuber samples collected 0, 24, and 48 hpi were subjected to RNA-seq, revealing a total of 1,102 DE genes between water- and P. infestans-inoculated comparisons within the same genotype and the same time. Log2(FPKM_p.inf/FPKM_mock) values were used to cluster 1,102 DE genes (FDR<0.001) in Cluster 3.0 [51] using uncentered correlation and the complete linkage method. Results were visualized using Treeview [51]. (A) Global visualization of the 1,102 DE genes; (B) A small gene cluster differentially regulated in +RB and WT at 24 and 48 hpi; (C) A small gene cluster differentially regulated in +RB and WT only at 48 hpi. Red indicates genes that are up-regulated, green indicates genes that are down-regulated.
Figure 6
Figure 6
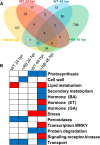
Tubers of the +RB line have a higher frequency of differentially expressed (DE) genes 48 hours post inoculation (hpi) with Phytophthora infestans, compared to WT (24 and 48 hpi) and +RB at 24 hpi. Tuber samples collected 0, 24, and 48 hpi were subjected to RNA-seq, revealing a total of 1,102 DE genes between water- and P. infestans-inoculated comparisons within the same genotype and the same time. (A) All 1,102 DE genes were analyzed using the “Venn count” function in the limma packages of R [53] and results were summarized as a Venn diagram. Red: WT 24 hpi; yellow: +RB 24 hpi; blue: WT 48 hpi; green: +RB 48 hpi. The results show that the +RB line is the main contributor of DE genes during water- vs. P. infestans-inoculated comparisons. (B) All 1,102 DE genes were also assigned to a MapMan ontology based on the Mercator mapping file (see methods), and subjected to Fisher’s exact test. Bins in red were significantly up-regulated; bins in blue were significantly down-regulated; transcription of bins in white did not change significantly. The results indicate that ontology bins encompassing ET metabolism and signaling are enriched for DE genes in +RB but not in WT at 48 hpi.
Figure 7
Figure 7
Stronger activation of defense related genes or gene groups correlates with successful tuber resistance against P. infestans. Tubers of ‘Russet Burbank’ (WT) and SP2211 (+RB) were inoculated with P. infestans and water. We compared the RNA-seq FPKM counts for WT and +RB using all 39,031 gene models included in the Potato Genome Sequencing Consortium (PGSC) v3 dataset (i.e., all genes were included, regardless of whether or not a given gene was DE). Genes were grouped into ontology bins using a Mapman mapping file. Each column represents a comparison between the two genotypes at a defined time point post inoculation, as indicated. Bins in blue are transcribed at higher levels in WT than in +RB; bins in red are transcribed at higher levels in +RB than in WT; bins in white did not significantly differ in transcript levels between WT and +RB. Results indicate that faster and stronger activation of defense bins, most notably biotic stress response and receptor kinase bins, occurred in tubers of the tuber late blight resistant +RB line.

References

    1. Stevenson WR, Loria R, Frank GD, Weingartner DP. Compedium of potato diseases. Saint Paul, MN, USA: APS Press; 2001.
    1. Kirk WW, Felcher KJ, Douches DS, Niemira BA, Hammerschmidt R. Susceptibility of potato (Solanum tuberosum L.) foliage and tubers to the US8 genotype of Phytophthora infestans. Am J Potato Res. 2001;78(4):319–322. doi: 10.1007/BF02875697. - DOI
    1. Song JQ, Bradeen JM, Naess SK, Raasch JA, Wielgus SM, Haberlach GT, Liu J, Kuang HH, Austin-Phillips S, Buell CR. Gene RB cloned from Solanum bulbocastanum confers broad spectrum resistance to potato late blight. Proc Natl Acad Sci USA. 2003;100(16):9128–9133. doi: 10.1073/pnas.1533501100. - DOI - PMC - PubMed
    1. van der Vossen E, Sikkema A, Hekkert BTL, Gros J, Stevens P, Muskens M, Wouters D, Pereira A, Stiekema W, Allefs S. An ancient R gene from the wild potato species Solanum bulbocastanum confers broad-spectrum resistance to Phytophthora infestans in cultivated potato and tomato. Plant J. 2003;36(6):867–882. doi: 10.1046/j.1365-313X.2003.01934.x. - DOI - PubMed
    1. Bradeen JM, Lorizzo M, Mollov DS, Raasch J, Kramer LC, Millett BP, Austin-Phillips S, Jiang JM, Carputo D. Higher copy numbers of the potato RB transgene correspond to enhanced transcript and late blight resistance levels. Mol Plant Microbe Interact. 2009;22(4):437–446. doi: 10.1094/MPMI-22-4-0437. - DOI - PubMed

Publication types

MeSH terms

LinkOut - more resources