

Spatiotemporal linear mixed effects modeling for the mass-univariate analysis of longitudinal neuroimage data
- PMID: 23702413
- PMCID: PMC3816382
- DOI: 10.1016/j.neuroimage.2013.05.049
Spatiotemporal linear mixed effects modeling for the mass-univariate analysis of longitudinal neuroimage data
Erratum in
- Neuroimage. 2015 Mar;108:123
Abstract
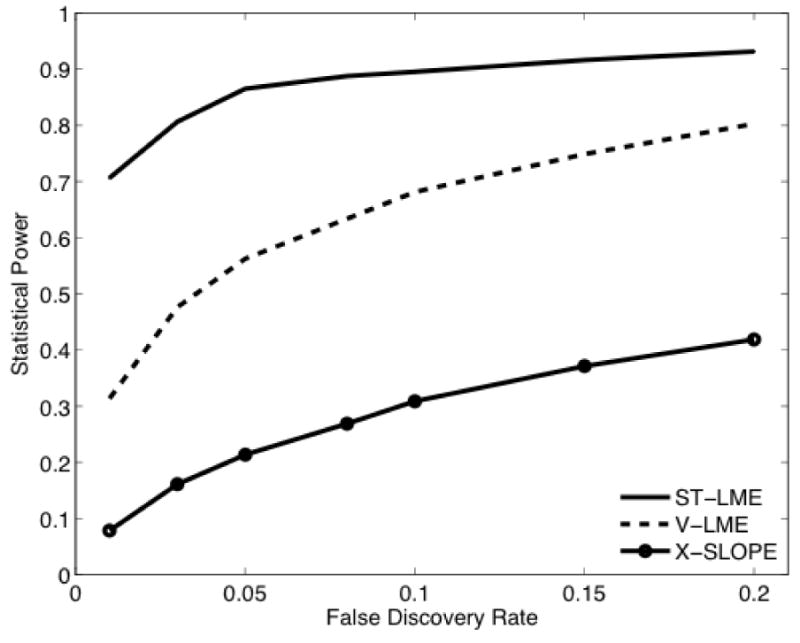
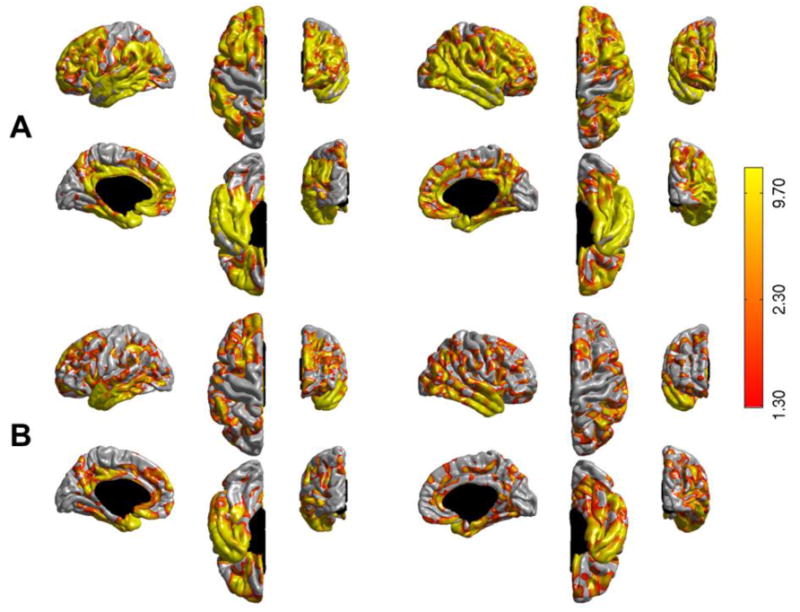
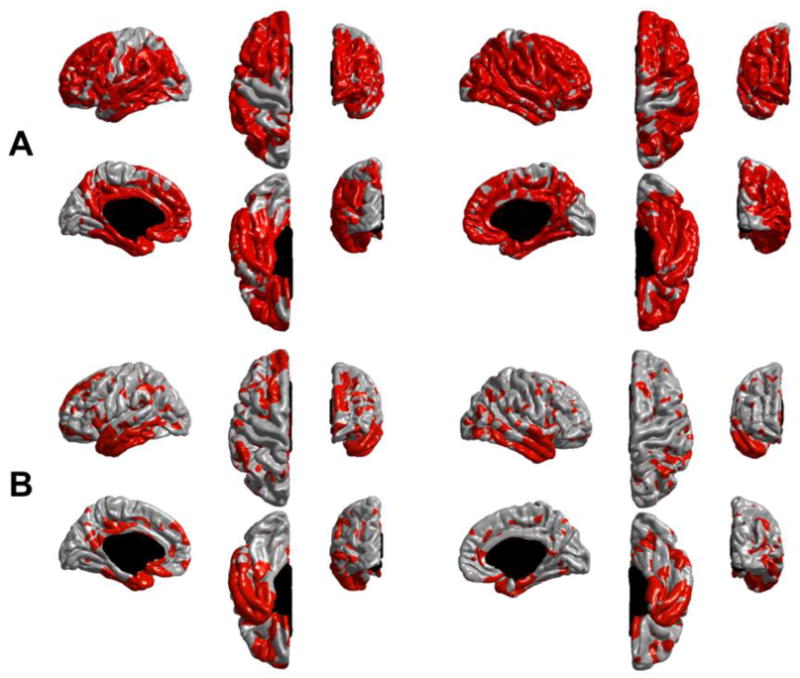
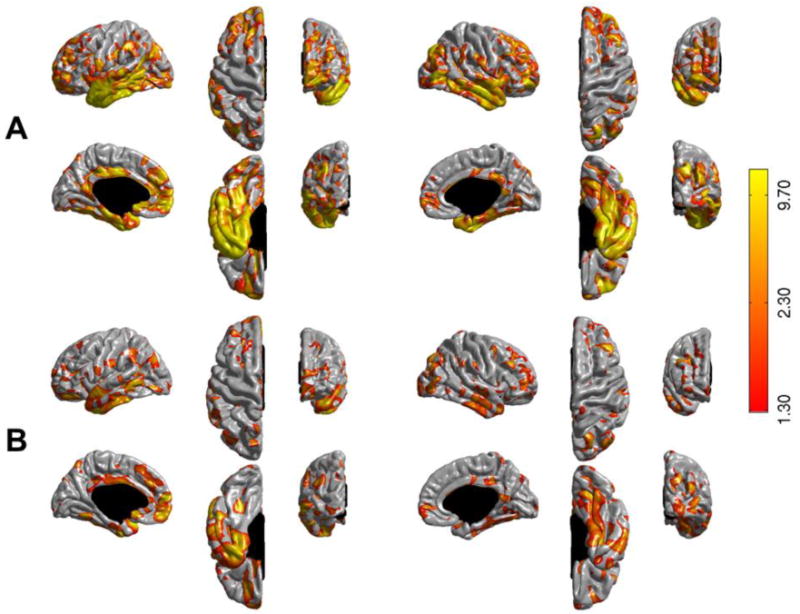
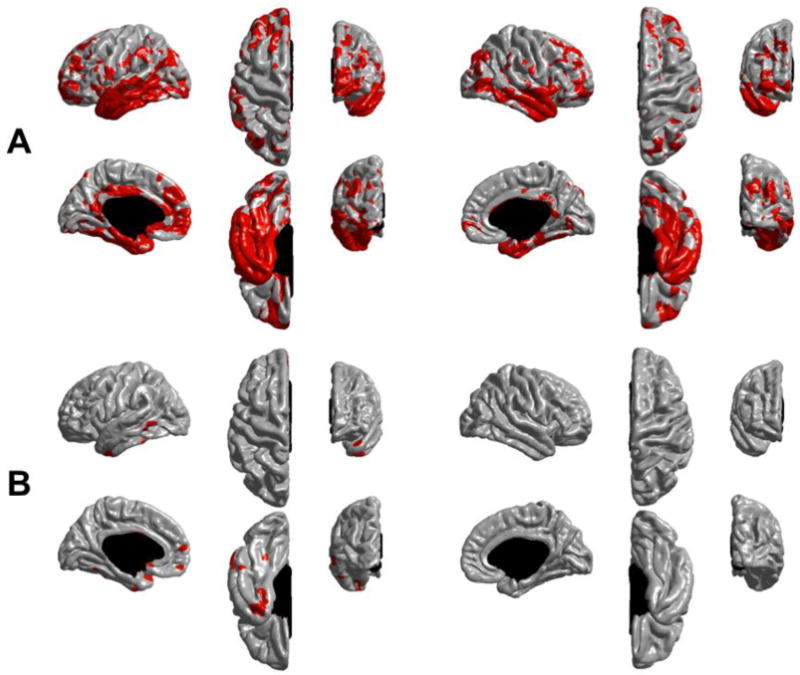
We present an extension of the Linear Mixed Effects (LME) modeling approach to be applied to the mass-univariate analysis of longitudinal neuroimaging (LNI) data. The proposed method, called spatiotemporal LME or ST-LME, builds on the flexible LME framework and exploits the spatial structure in image data. We instantiated ST-LME for the analysis of cortical surface measurements (e.g. thickness) computed by FreeSurfer, a widely-used brain Magnetic Resonance Image (MRI) analysis software package. We validate the proposed ST-LME method and provide a quantitative and objective empirical comparison with two popular alternative methods, using two brain MRI datasets obtained from the Alzheimer's disease neuroimaging initiative (ADNI) and Open Access Series of Imaging Studies (OASIS). Our experiments revealed that ST-LME offers a dramatic gain in statistical power and repeatability of findings, while providing good control of the false positive rate.
Keywords: Linear Mixed Effects models; Longitudinal studies; Mass-univariate analysis; Statistical analysis.
Copyright © 2013 Elsevier Inc. All rights reserved.
Figures


References
-
- Benjamini Y, Krieger AM, Yekutieli D. Adaptive linear step-up procedures that control the false discovery rate. Biometrika. 2006;93:491–507.
-
- Bernal-Rusiel JL, Atienza M, Cantero JL. Determining the optimal level of smoothing in cortical thickness analysis: A hierarchical approach based on sequential statistical thresholding. Neuroimage. 2010;52:158–171. - PubMed
-
- Blockx I, Van Camp N, Verhoye M, Boisgard R, Dubois A, Jego B, Jonckers E, Raber K, Siquier K, Kuhnast B, Dolle F, Nguyen HP, Von Horsten S, Tavitian B, Van der Linden A. Genotype specific age related changes in a transgenic rat model of Huntington’s disease. Neuroimage. 2011;58:1006–1016. - PubMed
Publication types
MeSH terms
Grants and funding
- R01 NS052585-01/NS/NINDS NIH HHS/United States
- R01-HD071664/HD/NICHD NIH HHS/United States
- P01 AG003991/AG/NIA NIH HHS/United States
- U01 AG024904/AG/NIA NIH HHS/United States
- 5P01NS058793-03/NS/NINDS NIH HHS/United States
- 1K25EB013649-01/EB/NIBIB NIH HHS/United States
- AG022381/AG/NIA NIH HHS/United States
- R01 AG008122/AG/NIA NIH HHS/United States
- 1R01NS070963/NS/NINDS NIH HHS/United States
- 1S10RR023401/RR/NCRR NIH HHS/United States
- 5U01-MH093765/MH/NIMH NIH HHS/United States
- RC1 AT005728-01/AT/NCCIH NIH HHS/United States
- KL2 RR025757/RR/NCRR NIH HHS/United States
- P41-RR14075/RR/NCRR NIH HHS/United States
- K25 EB013649/EB/NIBIB NIH HHS/United States
- R01EB006758/EB/NIBIB NIH HHS/United States
- R01 AG016495/AG/NIA NIH HHS/United States
- 2R01NS042861-06A1/NS/NINDS NIH HHS/United States
- 1S10RR019307/RR/NCRR NIH HHS/United States
- 1S10RR023043/RR/NCRR NIH HHS/United States
- 1R21NS072652-01/NS/NINDS NIH HHS/United States
LinkOut - more resources
Full Text Sources
Other Literature Sources
