. 2013 Oct 15:80:125-43.
doi: 10.1016/j.neuroimage.2013.05.057. Epub 2013 May 20.

Advances in diffusion MRI acquisition and processing in the Human Connectome Project

Collaborators, Affiliations

Advances in diffusion MRI acquisition and processing in the Human Connectome Project

Stamatios N Sotiropoulos et al. Neuroimage. .

Abstract

The Human Connectome Project (HCP) is a collaborative 5-year effort to map human brain connections and their variability in healthy adults. A consortium of HCP investigators will study a population of 1200 healthy adults using multiple imaging modalities, along with extensive behavioral and genetic data. In this overview, we focus on diffusion MRI (dMRI) and the structural connectivity aspect of the project. We present recent advances in acquisition and processing that allow us to obtain very high-quality in-vivo MRI data, whilst enabling scanning of a very large number of subjects. These advances result from 2 years of intensive efforts in optimising many aspects of data acquisition and processing during the piloting phase of the project. The data quality and methods described here are representative of the datasets and processing pipelines that will be made freely available to the community at quarterly intervals, beginning in 2013.


Figures

Figure 1
Figure 1
Representative examples of dMRI with a Siemens Trio and the Connectome Skyra (not maximum gradient strength). Image intensities are in SNR units. Notice the increased SNR provided by the Connectome scanner (middle column), particularly for the diffusion-weighted volumes. In this example, the slightly reduced SNR in the multiband sequence is a consequence of T1 saturation effects due to the shortened TR, and not due to inherent SNR losses associated with multiband imaging (From left to right, echo and repetition times were: TE=94, 78, 78 ms and TR=9.3s, 7.8s, 2.6s, respectively). Data from the different scanners are from different subjects. Spatial resolution is 2 mm isotropic. No distortion correction has been performed.
Figure 2
Figure 2
A) Spatial variations in the b value of a [1 0 0] gradient (intended b=3000 s/mm2), caused by the gradient nonlinearities. The color code represents variations in the order of ±15%. The histogram shows the distribution of the b values within the brain volume. B) Representative examples of mean diffusivity (MD) maps of a spherical water phantom (phantom diameter ~18 cm), before and after considering the gradient nonlinearities in the diffusion tensor estimation. The phantom is positioned at three different locations within the scanner (from left to right: at the isocentre, 6cm above and 6cm right to the isocentre) and scanned at b=400 s/mm2. C) For each of the phantom locations, histograms of the MD and Fractional Anisotropy (FA) values of the water phantom are shown, before (blue) and after correction (red) for gradient nonlinearities.
Figure 3
Figure 3
Sensitivity of different q-space sampling schemes in resolving (two and three-way) crossing fibres within the centrum semiovale. The amount of crossings resolved by each scheme is normalised by the maximum. Fibre orientations are estimated using the ball & stick model (Behrens et al., 2007) for single-shell schemes and its extension (Jbabdi et al., 2012) for multi-shell protocols. A comparison between various single, two and three-shell combinations in the b=0–10,000 s/mm2 regime is shown in (A). Data for all compared schemes are from the same subject. Multi-shell protocols with the number of data points being constant across shells and protocols where the number of data points increases linearly with b value are included. A comparison between various multi-shell schemes in the more restricted b=0–3,000 s/mm2 regime is shown in (B). Data for all compared schemes are from the same subject. In both comparisons, protocols were matched for the total number of data points (282 points in q-space acquired twice) and spatial resolution (1.25 mm isotropic). Crossing detection is performed using a Bayesian automatic relevance determination (ARD) method (Behrens et al., 2007). To increase contrast in the differences between protocols a higher than normal ARD prior weight (w=10) has been employed.
Figure 4
Figure 4
Probabilistic tractography results on axial slices at the level of the basal ganglia and the thalamus when seeding from the hand area of the primary motor cortex (left hemisphere). Each panel shows results for different spatial resolution (2mm, 1.5mm and 1.25mm isotropic). All datasets are matched for acquisition time. Color-coded path probability values are plotted on an axial slice in standard MNI space. The green arrows correspond from medial to lateral to: cortico-thalamic, cortico-bulbar, cortico-spinal and cortico-striatal projections. Images are shown in radiological view.
Figure 5
Figure 5
A) Histograms of dMRI signal intensities within the CSF (therefore maximally attenuated) for two different image reconstruction methods. The Root-Sum-of-Squares (RSoS) produces a signal that follows a non-central-chi distribution, whereas the SENSE1 approach results to a Rician distributed signal. B) Difference in the dynamic range of the signal produced by RSoS (red) and SENSE1 (blue). The signal from a voxel in the midbody of the corpus callosum is plotted. Data points are sorted according to the angular difference of the respective diffusion gradient direction with the major callosal fibre orientation (i.e. parallel to perpendicular to the main fibre orientation). The noise floor (the minimum measurable signal) is elevated with RSoS, which therefore rectifies measurements along the major fibre orientation in highly anisotropic regions.
Figure 6
Figure 6
Correction of susceptibility-induced distortions using pairs of phase encoding (PE)-reversed b=0 images. Distortions flip sign when the PE direction is reversed. Using information from both images a distortion-free image can be obtained. Spatial resolution in this example is 1.25 mm isotropic. Axial (top) and coronal (bottom) views are presented.
Figure 7
Figure 7
Comparison between correction methods for eddy current-induced distortions. A) One-dimensional profile (green line in the inset) across the different dMRI volumes (i.e. as a function of acquisition time). Artifacts are evident as variations of the slice boundaries (green arrows). The Gaussian Process (GP)-based approach achieves a better performance in registering all volumes compared to a commonly used affine transformation-based correction. The data are from a b=3000 s/mm2 acquisition. B) Mean and standard deviation of sum of squared differences (SSD) between image intensities across 150 pairs of dMRI volumes. DMRI volumes with LR phase encoding (PE) direction were followed by the same volumes acquired with RL PE direction. After correcting for susceptibility-induced distortions, the SSDs were obtained for all dMRI pairs. The data for each b value were normalised by the 95th percentile of all the raw dMRI signal intensities within the brain.
Figure 8
Figure 8
Fibre orientations (RGB-color coded Red:left-right, Green:Anterior-Posterior, Blue: Inferior-Superior) using single and multi-shell datasets, matched for acquisition time (spatial resolution 1.25 mm isotropic) (axial views). The single-shell ball & stick (Behrens et al., 2007) and its multi-shell extension (Jbabdi et al., 2012) have been employed for the respective datasets (each with up to three fibre compartments per voxel). Yellow arrows show areas of improvement using multi-shell as discussed in main text. Zoomed-in versions of these areas are shown in panel B. Orientation vectors are superimposed on gray-scale maps representing the total anisotropic volume fraction in each voxel (i.e. the sum of volume fractions of compartments that model anisotropic diffusion in the multi-compartment ball & stick model). Orientations are shown only when the respective volume fraction is larger than 5%.
Figure 9
Figure 9
Fibre orientations (RGB-color coded Red:left-right, Green:Anterior-Posterior, Blue: Inferior-Superior) using single and multi-shell datasets, matched for acquisition time (spatial resolution 1.25 mm isotropic) (coronal views). The single-shell ball & stick (Behrens et al., 2007) and its multi-shell extension (Jbabdi et al., 2012) have been employed for the respective datasets (each with up to three fibre compartments per voxel). Yellow arrows show areas of improvement using multi-shell as discussed in main text. Zoomed-in versions of these areas are shown in panel B. Orientation vectors are superimposed on gray-scale maps representing the total anisotropic volume fraction in each voxel (i.e. the sum of volume fractions of compartments that model anisotropic diffusion in the multi-compartment ball & stick model). Orientations are shown only when the respective volume fraction is larger than 5%.
Figure 10
Figure 10
Connectome Workbench allows visualization of probabilistic tractography in a number of ways. A) Left: Probabilistic trajectories arising from a seed in the inferior parietal cortex (yellow arrow on the right and dot in (B) and (C)). The contralateral pial surface is also shown. Only streamline samples that intersect the cortical surface at one or more locations are considered. A 3D trajectory is made up of the fiber orientations employed by the probabilistic samples during tractography. The orientation vectors are RGB color-coded and with opacity representative of the underlying number of streamlines that took the particular fiber orientation. Right: Part of the same distribution is shown for a single saggital slice, superimposed on a T1w image. The white/gray matter boundary surface is shown with the black solid line. The corresponding location on the left is shown encircled. B) Structural connectivity values for the same seed are displayed on the white/gray matter boundary surface. C) Average structural connectivity values for the same seed across 9 subjects. Results are presented in log-scale and on an inflated average surface.
Figure 11
Figure 11
Exemplar data quality at different b values, representative of the final HCP diffusion MRI protocol and pre-processing pipeline. Spatial resolution is 1.25mm isotropic. Images for each b value correspond to a single gradient direction, with the respective LR and RL acquisitions combined after distortion correction.
Figure 12
Figure 12
Coronal views of fractional anisotropy (FA) and RGB-color coded direction maps obtained using the DTI model on HCP data (top) and data from a different subject acquired using a Siemens Verio 3T system (bottom). Datasets are matched for acquisition time, but have slightly different positioning. The HCP dataset was a subset of the full multi-shell data, and comprised of 90 directions at b=1000 s/mm2 (acquired twice, at 1.25mm isotropic resolution, MB=3). The Verio dataset comprised of 60 directions at b=1000 s/mm2 (acquired twice, at 2mm isotropic resolution, no MB). For both cases, the same distortion correction pipeline was utilised.
Figure 13
Figure 13
Probabilistic tractography results using the HCP dMRI data for the connection between the insula and the anterior cingulate cortex. A) A coronal maximum intensity projection of the path probability map is shown on the left (color code: red for low, yellow for high). The orientations composing the main trajectory through the anterior centrum semiovale is shown in black on the right, while orientations employed by crossing tracts are shown RGB color-coded. B) Binarised tractograms of different bundles the insula-cingulate connection (orange) has to cross from a coronal and sagittal perspective (probability threshold 0.1%). Tractograms are rendered in 3D along with a T1w image and correspond to callosal projections (green), pyramidal tract projections (blue) and longitudinal fasciculi (yellow). Tractography has been performed with multi-shell parametric deconvolution (Jbabdi et al., 2012), modeling up to three fibres per voxel.
Figure 14
Figure 14
Cortical radial anisotropy evident in high-quality post-mortem data (isotropic spatial resolution of 0.94mm) using Steady-State Free Precession (SSFP) (Miller et al., 2012). Cortical anisotropy can be also observed for the HCP datasets (isotropic spatial resolution of 1.25mm), but not for more commonly acquired in-vivo datasets (Siemens Verio 3T, isotropic spatial resolution 2mm). For all cases, the DTI principal eigenvector is superimposed on the FA map.
Figure 15
Figure 15
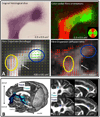
A) Validation of local estimates from diffusion MRI with histology in the macaque brain. Structure tensor analysis was employed to obtain estimates of the main fibre orientations, shown color-coded, (top right) from a histological section of the superior frontal gyrus (top left) of an early postnatal macaque (Van Essen et al., 2013a). Orientations were then grouped at larger pixels to match the in-plane spatial resolution of a post-mortem diffusion MRI scan (bottom left). These “ground-truth” cones of dispersion were compared to MRI-derived dispersion estimates (bottom right) using the ball and racket model. Spatial resolution is mentioned at the bottom of each sub-figure. B) Validation of tractography results with tracers in the macaque brain (Jbabdi et al., 2013). On the left, the 3D trajectory of the tractography-reconstructed paths (dark blue) seeded from the lateral orbitofrontal cortex (OFC) and going through the internal capsule is shown along with the axonal connections revealed by chemical tracing (light blue) from the same region. On the right, the entry point of connections from the OFC into the cingulum bundle is shown. The estimated location through tractography (bottom) is almost identical to the ground-truth (top). Coronal and sagittal views are presented.

Similar articles

  • The WU-Minn Human Connectome Project: an overview.
    Van Essen DC, Smith SM, Barch DM, Behrens TE, Yacoub E, Ugurbil K; WU-Minn HCP Consortium. Van Essen DC, et al. Neuroimage. 2013 Oct 15;80:62-79. doi: 10.1016/j.neuroimage.2013.05.041. Epub 2013 May 16. Neuroimage. 2013. PMID: 23684880 Free PMC article. Review.
  • The minimal preprocessing pipelines for the Human Connectome Project.
    Glasser MF, Sotiropoulos SN, Wilson JA, Coalson TS, Fischl B, Andersson JL, Xu J, Jbabdi S, Webster M, Polimeni JR, Van Essen DC, Jenkinson M; WU-Minn HCP Consortium. Glasser MF, et al. Neuroimage. 2013 Oct 15;80:105-24. doi: 10.1016/j.neuroimage.2013.04.127. Epub 2013 May 11. Neuroimage. 2013. PMID: 23668970 Free PMC article.
  • Adding dynamics to the Human Connectome Project with MEG.
    Larson-Prior LJ, Oostenveld R, Della Penna S, Michalareas G, Prior F, Babajani-Feremi A, Schoffelen JM, Marzetti L, de Pasquale F, Di Pompeo F, Stout J, Woolrich M, Luo Q, Bucholz R, Fries P, Pizzella V, Romani GL, Corbetta M, Snyder AZ; WU-Minn HCP Consortium. Larson-Prior LJ, et al. Neuroimage. 2013 Oct 15;80:190-201. doi: 10.1016/j.neuroimage.2013.05.056. Epub 2013 May 20. Neuroimage. 2013. PMID: 23702419 Free PMC article.
  • The Lifespan Human Connectome Project in Aging: An overview.
    Bookheimer SY, Salat DH, Terpstra M, Ances BM, Barch DM, Buckner RL, Burgess GC, Curtiss SW, Diaz-Santos M, Elam JS, Fischl B, Greve DN, Hagy HA, Harms MP, Hatch OM, Hedden T, Hodge C, Japardi KC, Kuhn TP, Ly TK, Smith SM, Somerville LH, Uğurbil K, van der Kouwe A, Van Essen D, Woods RP, Yacoub E. Bookheimer SY, et al. Neuroimage. 2019 Jan 15;185:335-348. doi: 10.1016/j.neuroimage.2018.10.009. Epub 2018 Oct 15. Neuroimage. 2019. PMID: 30332613 Free PMC article.
  • The Human Connectome Project: a data acquisition perspective.
    Van Essen DC, Ugurbil K, Auerbach E, Barch D, Behrens TE, Bucholz R, Chang A, Chen L, Corbetta M, Curtiss SW, Della Penna S, Feinberg D, Glasser MF, Harel N, Heath AC, Larson-Prior L, Marcus D, Michalareas G, Moeller S, Oostenveld R, Petersen SE, Prior F, Schlaggar BL, Smith SM, Snyder AZ, Xu J, Yacoub E; WU-Minn HCP Consortium. Van Essen DC, et al. Neuroimage. 2012 Oct 1;62(4):2222-31. doi: 10.1016/j.neuroimage.2012.02.018. Epub 2012 Feb 17. Neuroimage. 2012. PMID: 22366334 Free PMC article. Review.

Cited by

References

    1. Aganj I, Lenglet C, Sapiro G, Yacoub E, Ugurbil K, Harel N. Reconstruction of the orientation distribution function in single- and multiple-shell q-ball imaging within constant solid angle. Magnetic Resonance in Medicine. 2010;64:554–566. - PMC - PubMed
    1. Alexander DC. Maximum entropy spherical deconvolution for diffusion MRI. Inf Process Med Imaging. 2005;19:76–87. - PubMed
    1. Alexander DC, Hubbard PL, Hall MG, Moore EA, Ptito M, Parker GJ, Dyrby TB. Orientationally invariant indices of axon diameter and density from diffusion MRI. Neuroimage. 2010;52:1374–1389. - PubMed
    1. Anderson AW. Measurement of fiber orientation distributions using high angular resolution diffusion imaging. Magn Reson Med. 2005;54:1194–1206. - PubMed
    1. Andersson JLR, Xu J, Yacoub E, Auerbach EJ, Moeller S, Ugurbil K. A comprehensive gaussian process framework for correcting distortions and movements in diffusion images; Melbourne, Australia. International Society for Magnetic Resonance in Medicine (ISMRM) Annual Meeting; 2012. p. 2426.

Publication types