. 2013 Aug;41(14):6857-69.
doi: 10.1093/nar/gkt438. Epub 2013 May 23.

Expression of a large LINE-1-driven antisense RNA is linked to epigenetic silencing of the metastasis suppressor gene TFPI-2 in cancer

Affiliations

Expression of a large LINE-1-driven antisense RNA is linked to epigenetic silencing of the metastasis suppressor gene TFPI-2 in cancer

Hazel A Cruickshanks et al. Nucleic Acids Res. 2013 Aug.

Abstract

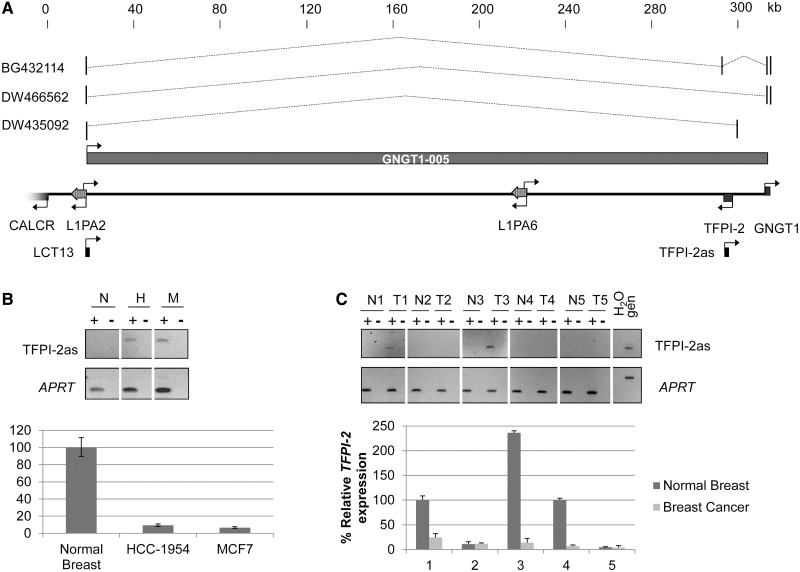
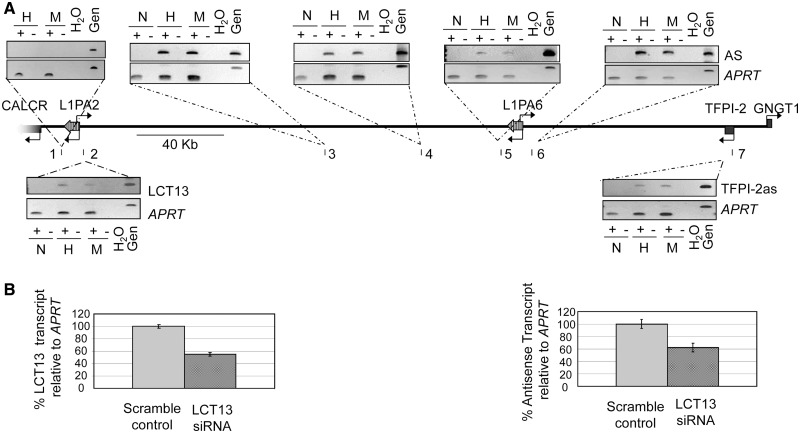
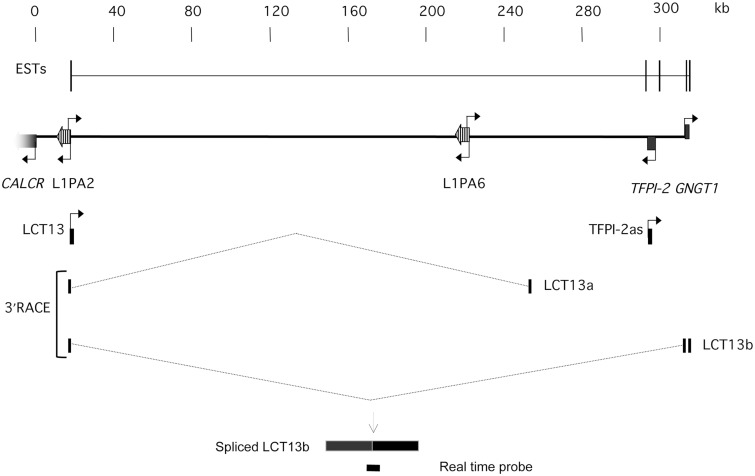
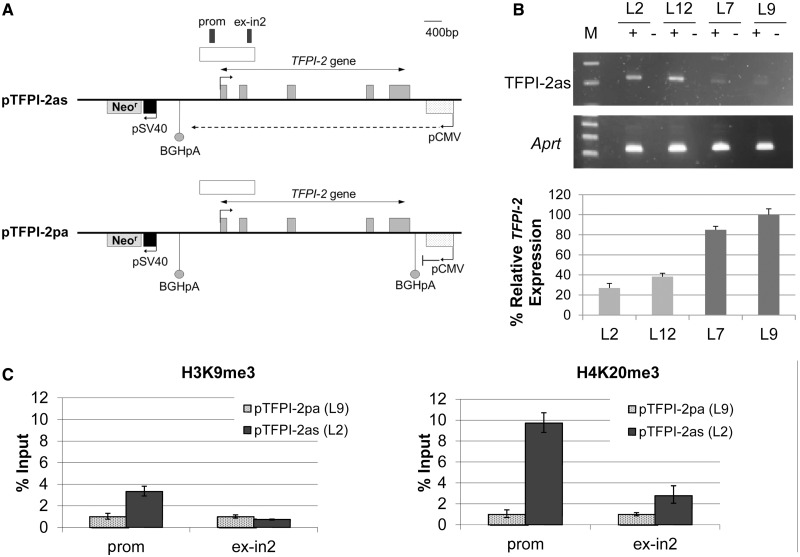
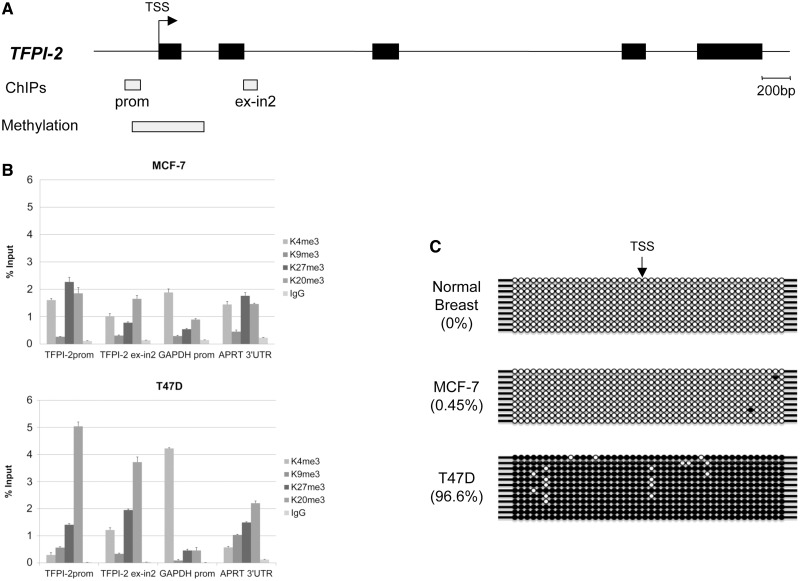
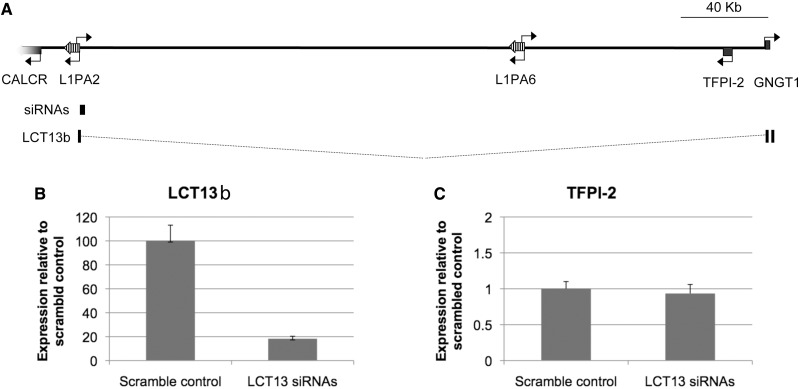
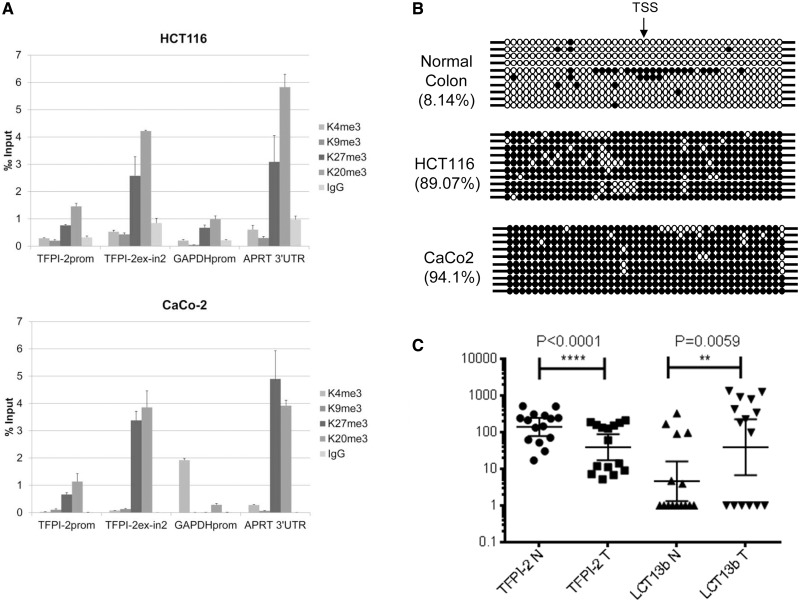
LINE-1 retrotransposons are abundant repetitive elements of viral origin, which in normal cells are kept quiescent through epigenetic mechanisms. Activation of LINE-1 occurs frequently in cancer and can enable LINE-1 mobilization but also has retrotransposition-independent consequences. We previously reported that in cancer, aberrantly active LINE-1 promoters can drive transcription of flanking unique sequences giving rise to LINE-1 chimeric transcripts (LCTs). Here, we show that one such LCT, LCT13, is a large transcript (>300 kb) running antisense to the metastasis-suppressor gene TFPI-2. We have modelled antisense RNA expression at TFPI-2 in transgenic mouse embryonic stem (ES) cells and demonstrate that antisense RNA induces silencing and deposition of repressive histone modifications implying a causal link. Consistent with this, LCT13 expression in breast and colon cancer cell lines is associated with silencing and repressive chromatin at TFPI-2. Furthermore, we detected LCT13 transcripts in 56% of colorectal tumours exhibiting reduced TFPI-2 expression. Our findings implicate activation of LINE-1 elements in subsequent epigenetic remodelling of surrounding genes, thus hinting a novel retrotransposition-independent role for LINE-1 elements in malignancy.


Figures

Figure 1.
Figure 1.
Correlated expression of LCT13 and TFPI-2as transcripts in breast cancer cells. (A) Schematic diagram of a 300-kb region of chromosome 7q21.3 including LCT13 and the TFPI-2 gene. Scale is kilobase and indicates the position from the centromere with the value of 0 arbitrarily assigned to the TSS of CALCR. Genes (5′ segment of CALCR, TFPI-2 and GNGT1) are indicated as gray arrows. Two LINE-1 elements are present in the region (L1PA2 and L1PA6). Transcriptional orientations are indicated by arrows. LCT13 is a previously identified transcript shown to initiate at an L1ASP by 5′ RACE (22). TFPI-2as is the fragment analysed by strand-specific RT–PCR to test for the presence of TFPI-2 antisense RNAs. Displayed are the three spliced ESTs isolated from kidney (BG432114) and liver (DW466562 and DW435092) libraries that initiate at the LINE1 antisense promoter like LCT13 and extend past the TFPI-2 gene with a putative alternative transcript GNGT1-005 also annotated. (B) Expression of TFPI-2as (upper) and TFPI-2 (lower) in normal breast (N) and in breast cancer cell lines (H, HCC-1954; M, MCF7) analysed by strand specific and real-time RT–PCR, respectively. TFPI-2 expression is reduced in both breast cancer cell lines compared to normal controls (n = 3). TFPI-2 expression levels were normalized to HPRT. (C) Expression of TFPI-2as (upper) and TFPI-2 (lower) in a panel of five matched normal and tumour breast tissue analysed as described in B.
Figure 2.
Figure 2.
LCT13 and TFPI-2as expression is linked. (A) Schematic diagram of the genomic region in Figure 1A indicating regions (1–7) analysed by strand-specific RT–PCR (middle). Shown above and below the schematic are the ethidium bromide–stained gels used to visualize the strand-specific RT–PCR. Regions 2–7 are specifically expressed in cancer cell lines (H, HCC-1954 and M, MCF-7), but not normal breast (N), showing that cancer-specific antisense transcription is detectable up to 300 kb away from the TFPI-2 gene and up to the LINE-1 retrotransposon associated with LCT13. (B) siRNA knockdown of the LCT13 transcript. 2D densitometry of semiquantitative strand-specific RT–PCR analysis normalized to APRT control reveals an approximate 50% knockdown in LCT13 levels in cells transfected with a pool of three siRNA duplexes directed against LCT13 compared to those transfected with scrambled control siRNAs (left panel). This is paralleled by a 40–50% decrease in the TFPI-2as transcript (right panel).
Figure 3.
Figure 3.
LCT13 and TFPI-2as are part of the same large transcript. Schematic diagram of the 7q21.3 region described in Figure 1A with annotated LCT13 splicing isoforms LCT13a and LCT13b isolated specifically from cancer cells by 3′ RACE anchored on LCT13. The combined ESTs described in Figure 1A are shown above for comparison purposes. Note that the LCT13b isoform includes exons 2 and 3 of the GNGT1 gene, encompassing TFPI-2, consistent with the presence of uninterrupted transcription across this region in cancer cell lines. Below this is a drawing of the custom Taqman assay designed to study LCT13b expression. The probe spans the splice site between the L1PA2 LINE-1ASP and GNGT1 exon 2. Spliced LCT13b and real time probe are not drawn to scale.
Figure 4.
Figure 4.
A human TFPI-2 transgene is sensitive to antisense RNA repression in mouse ES cells. (A) Schematic diagram of constructs introduced into mouse ES cells: pTFPI-2as is designed to transcribe antisense to TFPI-2 from a CMV promoter, while pTFPI-2pa has a poly-A signal insertion downstream of the CMV promoter to block antisense transcription. Arrows indicate direction of transcription. Regions analysed by ChIP are annotated as ‘prom’ and ‘ex-in2’. (B) Strand-specific RT–PCR analysis of TFPI-2 antisenese (TFPI-2as) expression in transgenic mouse ES cell lines demonstrates increased levels in pTFPI-2as lines (L2 and L12) relative to pTFPI-2pa cells (L7 and L9), mouse Aprt acts as a positive control for RNA quality and quantity. This correlates with a reduction in TFPI-2 expression as shown by real-time PCR normalized to mouse Gapdh. (C) ChIP analysis followed by real-time PCR. Left panel: Antibodies to H3K9me3 reveal localized enrichment of H3K9me3 in the promoter region in the antisense expressing cell line, pTFPI-2as (L2), compared to cells transfected with pTFPI-2pa (L9), which express low levels of TFPI-2as. Right panel: Antibodies to H4K20me3 also show enrichment at the TFPI-2 promoter in pTFPI-2as compared to pTFPI-2pa.
Figure 5.
Figure 5.
Silencing of TFPI-2 in breast cancer. (A) Top panel: Schematic diagram of the TFPI-2 gene. Black boxes on the line represent exons of TFPI-2, and the bent arrow indicates the TSS. Light grey boxes labelled ChIP and methylation denote regions of the TFPI-2 CpG island analysed by ChIP and bisulphite sequencing, respectively. (B) ChIP assays in MCF-7 (top) and T47D (bottom) cells using antibodies against repressive histone marks H3K9me3, H3K27me3, H4K20me3, and active marks AcH3 and H3K4me3. Enrichment of H3K27me3 and H4K20me3 is seen in both cell lines at the TFPI-2 regions tested. (C) Bisulphite sequencing of DNA from normal breast, MCF-7 and T47D cells, shows that the TFPI-2 region studied is devoid of methylation in normal breast (0%) and MCF-7 cells (0.4%) but heavily methylated in T47D cells (96%). TSS indicates the transcriptional start site of the TFPI-2 gene; filled and open circles represent methylated and unmethylated CpG dinucleotides, respectively. Each row represents an independent clone.
Figure 6.
Figure 6.
LCT13 is not required for maintenance of silencing at TFPI-2. (A) Schematic diagram of the 7q21.3 region described in Figure 1A drawn to scale (bar is 40 kb) with the LCT13b transcript and the site targeted by the three independent siRNAs annotated. (B) Expression of LCT13 and (C) expression of TFPI-2 in MCF-7 cells treated with a pool of three LCT13 siRNAs or the equivalent scrambled control show that decreased LCT13b levels do not correspond to an increase in TFPI-2 in these cells.
Figure 7.
Figure 7.
Silencing of TFPI-2 in colorectal cancer. (A) Chromatin immunoprecipitation assays in HCT116 (top) and CaCo-2 (bottom) cells using antibodies against active histone marks AcH3, H3K4me3, and repressive histone marks H3K9me3, H3K27me3, and H4K20me3 indicate enrichment of repressive marks H3K27me3 and H4K20me3 at the TFPI-2 regions tested (see Figure 5A). (B) Bisulphite sequencing analysis of 10 independent clones from normal colon and HCT116 and CaCo-2 colon cancer cells shows that the TFPI-2 region studied is hypomethylated in normal colon (8.14% methylation) and hypermethylated in HCT116 and CaCo-2 cells (89.07 and 94.1% methylation, respectively). TSS indicates the transcriptional start site of the TFPI-2 gene; filled and open circles represent methylated and unmethylated CpG dinucleotides, respectively. Each row represents an independent clone. The region analysed by bisulphite sequencing is depicted in Figure 5A. (C) Analysis of LCT13 and TFPI-2 expression in matched normal and tumour tissues from sporadic cases of colorectal cancer shows an inverse relationship with a significant increase in LCT13 (P < 0.007, Wilcoxon test, n = 15) corresponding to a significant decrease in TFPI-2 in tumours. Real-time RT–PCR expression data was normalized to PGK1, GAPDH, and HPRT using GenEx software (Multid Analyses AB).

References

    1. Sharma S, Kelly TK, Jones PA. Epigenetics in cancer. Carcinogenesis. 2010;31:27–36. - PMC - PubMed
    1. Hammerman PS, Hayes DN, Wilkerson MD, Schultz N, Bose R, Chu A, Collisson EA, Cope L, Creighton CJ, Getz G, et al. Comprehensive genomic characterization of squamous cell lung cancers. Nature. 2012;489:519–525. - PMC - PubMed
    1. Feinberg AP, Tycko B. The history of cancer epigenetics. Nat. Rev. 2004;4:143–153. - PubMed
    1. Hon GC, Hawkins RD, Caballero OL, Lo C, Lister R, Pelizzola M, Valsesia A, Ye Z, Kuan S, Edsall LE, et al. Global DNA hypomethylation coupled to repressive chromatin domain formation and gene silencing in breast cancer. Genome Res. 2012;22:246–258. - PMC - PubMed
    1. Figueroa ME, Abdel-Wahab O, Lu C, Ward PS, Patel J, Shih A, Li Y, Bhagwat N, Vasanthakumar A, Fernandez HF, et al. Leukemic IDH1 and IDH2 mutations result in a hypermethylation phenotype, disrupt TET2 function, and impair hematopoietic differentiation. Cancer Cell. 2010;18:553–567. - PMC - PubMed

Publication types