. 2013 Nov;20(11):1465-74.
doi: 10.1038/cdd.2013.52. Epub 2013 May 24.

p53 regulates a non-apoptotic death induced by ROS

Affiliations

p53 regulates a non-apoptotic death induced by ROS

J Montero et al. Cell Death Differ. 2013 Nov.

Abstract

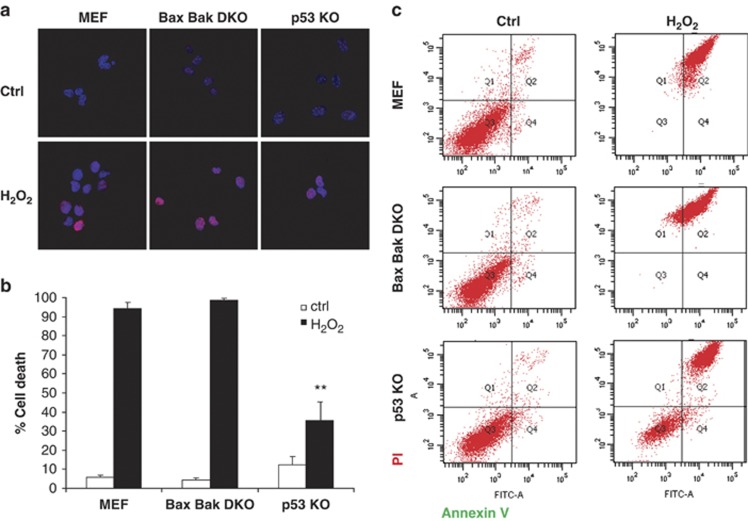
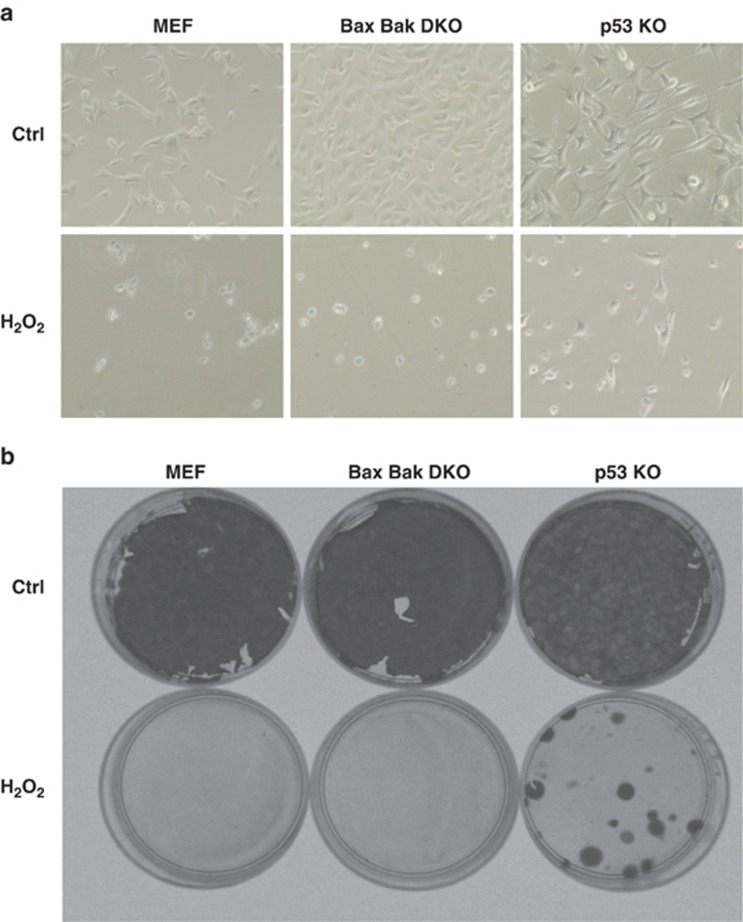
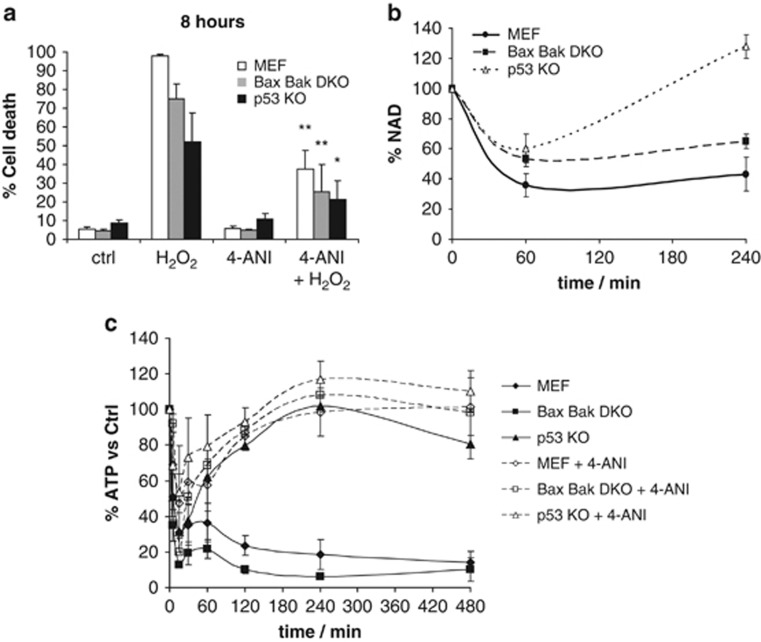
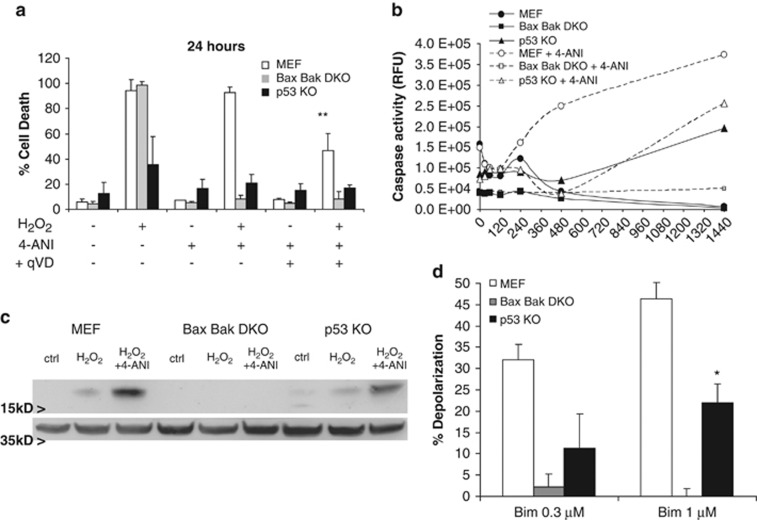
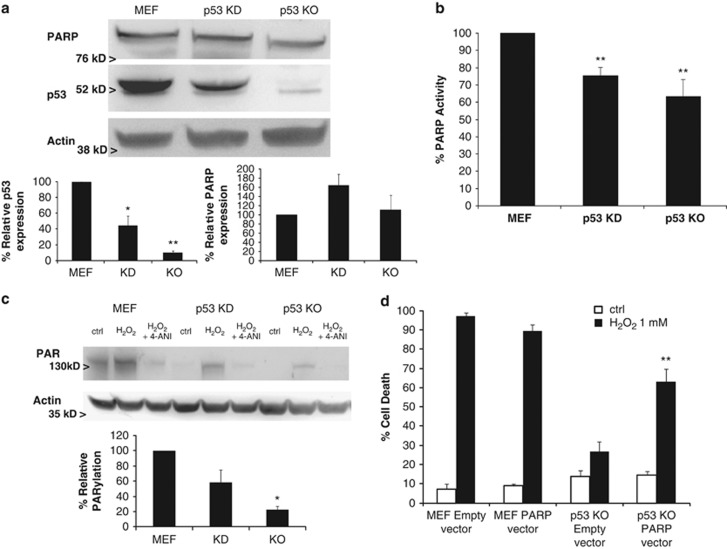
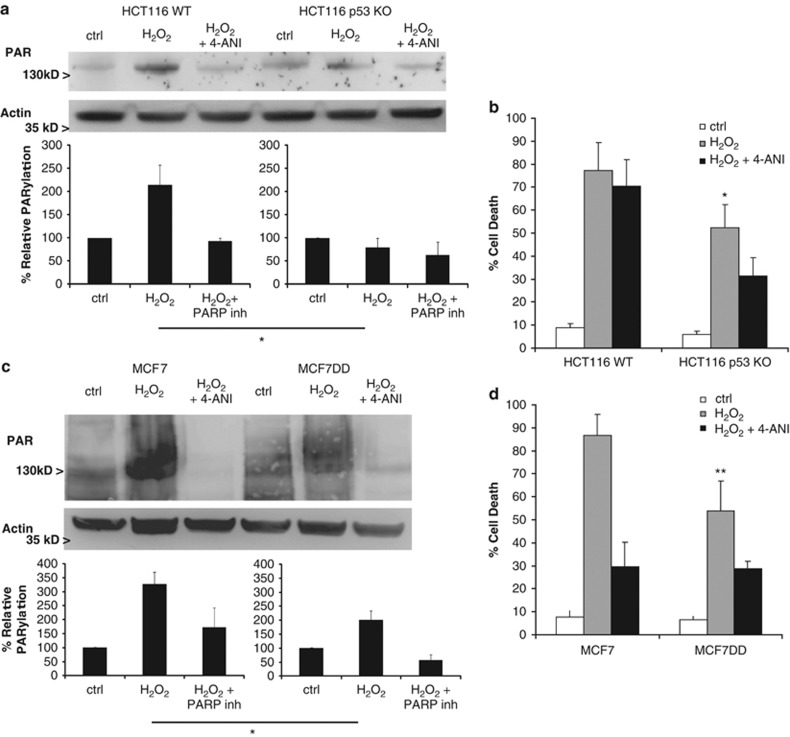
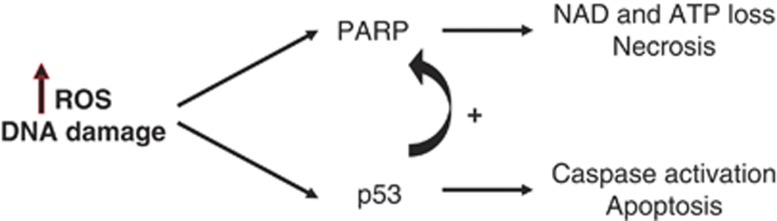
DNA damage induced by reactive oxygen species and several chemotherapeutic agents promotes both p53 and poly (ADP-ribose) polymerase (PARP) activation. p53 activation is well known to regulate apoptotic cell death, whereas robust activation of PARP-1 has been shown to promote a necrotic cell death associated with energetic collapse. Here we identify a novel role for p53 in modulating PARP enzymatic activity to regulate necrotic cell death. In mouse embryonic fibroblasts, human colorectal and human breast cancer cell lines, loss of p53 function promotes resistance to necrotic, PARP-mediated cell death. We therefore demonstrate that p53 can regulate both necrotic and apoptotic cell death, mutations or deletions in this tumor-suppressor protein may be selected by cancer cells to provide not only their resistance to apoptosis but also to necrosis, and explain resistance to chemotherapy and radiation even when it kills via non-apoptotic mechanisms.


Figures

Figure 1
Figure 1
p53 KO MEF cells, but not WT or Bax Bak DKO, survive to DNA damage induced by H2O2. (a) To assess DNA damage extent, cells were exposed to 1 mM H2O2 for 30 min and immunostained using anti-phospho Histone H2AX antibody (red). Nuclei were stained using DAPI (blue) and observed under a confocal microscope. Similar DNA damage extent was observed after treatment in all three cell lines. (b) WT MEF, Bax Bak DKO and p53 KO were treated for 24 h with 1 mM H2O2. Cells were stained with fluorescent conjugates of annexin-V and propidium iodide (PI) and analyzed by FACS. Viable cells are annexin-V negative and PI negative, and cell death is expressed as 100%-viable cells. Values indicate mean values±S.E.M. All experiments were performed independently at least three times (N≥3). **P<0.01 (compared with WT MEF H2O2-treated). (c) Cell death is expressed as 100% - viable cells. Representative FACS plots are shown
Figure 2
Figure 2
After DNA damage, p53 KO cells survive conserving their clonogenic capacities. (a) Images under an optical microscope were obtained before and after 1 mM H2O2 treatment for 24 h. WT MEF and DKO showed necrotic characteristics, whereas p53 KO conserved their morphology. (b) Colony formation assay. Cells were treated for 4 h with 1 mM H2O2 counted and 200 cell/well were plated. After 18 days, cells were fixed and stained with a crystal violet solution. Only p53 KO cells were able to form colonies after treatment. All experiments were performed three times (N=3)
Figure 3
Figure 3
H2O2 induces PARP-mediated cell death, with NAD loss and ATP collapse in WT MEF and DKO, but not in p53 KO cells. (a) WT MEF, DKO and p53 KO cells were treated for 8 h with 1 mM H2O2, with or without PARP inhibitor 2 μM 4-amino-1,8-naphthalimide (4-ANI) 16 h preincubation. Cells were stained with fluorescent conjugates of annexin-V and propidium iodide (PI) and analyzed by FACS. (b) NAD was measured using a fluorimetric assay. All three cell lines were treated for 1 or 4 h with 1 mM H2O2. Results are normalized to basal NAD levels. (c) ATP was measured after the same treatment at different time points (0, 5, 15, 30, 60, 120, 240 and 480 min), with or without 2 μM 4-ANI preincubation, using CellTiter-Glo Luminescent Cell Viability Assay. All values are expressed as percentage to basal ATP levels. Values indicate mean values±S.E.M. *P<0.05, **P<0.01 (compared with H2O2 treated). All experiments were performed independently at least three times (N≥3)
Figure 4
Figure 4
PARP inhibition induces time-delayed apoptosis in H2O2-treated cells. (a) MEFs were treated for 24 h with 1 mM H2O2, with or without a 16 h preincubation with PARP inhibitor 2 μM 4-ANI and/or the pan-caspase inhibitor 10 μM qVD-OPH. Cells were stained with fluorescent conjugates of annexin-V and propidium iodide (PI) and analyzed by FACS. **P<0.01 (compared to WT H2O2+4-ANI treated). (b) Caspase activation was measured after 1 mM H2O2 treatment, with or without a 2 μM 4-ANI, 16 h preincubation, at different time points (0, 15, 30, 60, 120, 240, 480 and 1440 min) using Caspase-Glo 3/7 Assay. All values are expressed as percentage to basal caspase 3/7 activity. (c) Caspase-3 activation by cleavage was detected by western blot in all three cell lines treated for 8 h with H2O2 with or without 4-ANI preincubation. Actin was used as loading control. (d) Apoptotic sensitivity measured by BH3 profiling using low concentrations of Bim peptide. WT MEF are more primed, showed more sensitivity, compared to p53 KO for apoptosis. DKO showed no priming, are resistant to apoptotic cell death. *P<0.05 (compared with WT MEF). Values indicate mean values±S.E.M. All experiments were performed independently at least three times (N≥3)
Figure 5
Figure 5
p53 loss impairs PARP activity and protects against PARP-mediated cell death. (a) Western blotting analysis of PARP-1 and p53 was performed in WT MEF, MEF shRNA p53 knockdown (KD) and p53 KO cells. Actin was used as loading control. (b) PARP activity was analyzed in all three cell lines using a colorimetric PARP ELISA assay kit with Histones-coated strip wells. Results are normalized to basal WT MEF PARP activity. **P<0.01. (c) Cells were treated for 1 h with 1 mM H2O2, with or without 4-ANI preincubation, and lysates (in the presence of PARG inhibitor ADP-HPD) were obtained and analyzed by western blot, immunostaining against protein-bound poly(ADP-ribose). Actin was used as loading control. p53 KD and KO showed a decreased PARP activity and protein PARylation, protecting against PARP-mediated cell death. (d) WT MEF and p53 KO, transfected with an empty or a PARP-1 overexpressing vector, were treated for 24 h with 1 mM H2O2. PARP-1 overexpression restored p53 sensitivity to H2O2. Cells were stained with fluorescent conjugates of annexin-V and propidium iodide (PI) and analyzed by FACS. Values indicate mean values±S.E.M. Densitometry analysis represent average±S.E.M. from at least three different western blots; KD and KO results were normalized to WT MEF. *P<0.05, **P<0.01. All experiments were performed independently at least three times (N≥3)
Figure 6
Figure 6
p53 loss protects against PARP-mediated cell death in human colon carcinoma cells. (a) HCT 116 WT and p53 KO cells, and (b) WT MCF7 or p53 dominant-negative (DD) cells were treated for 1 h with 1 mM H2O2, with or without 4-ANI preincubation, and lysates (in the presence of PARG inhibitor ADP-HPD) were obtained and analyzed by western blot to detect protein-bound poly(ADP-ribose). Actin was used as loading control. (b and d) Cell death was analyzed at 24 h under the same treatments. Cells were stained with fluorescent conjugates of annexin-V and propidium iodide (PI) and analyzed by FACS. HCT116 p53 KO and MCF7 DD cells showed less PARylation compared with their respective WT, and were protected against H2O2-induced cell death. (a) and (c) belong to the same blot and immunodetection. Error bars indicate mean values±S.E.M. *P<0.05, **P<0.01 (compared with control cells for each cellular type). Densitometry analysis represent average±S.E.M. from at least three different western blots; results were normalized to untreated cells (ctrl) for each cellular type. All experiments were performed independently at least three times (N≥3)
Figure 7
Figure 7
PARP-1 and p53 regulate each other activity. One of the many targets of PARP-1 is p53, covalently modifying the latter through poly(ADP-ribosyl)ation. On the other hand, p53 also regulates PARP-1 by modulating its activity. PARP-1 controls necrosis and p53 apoptosis after DNA damage, thus both types of cell death are well regulated

Comment in

References

    1. Ikediobi ON, Davies H, Bignell G, Edkins S, Stevens C, O'Meara S, et al. Mutation analysis of 24 known cancer genes in the NCI-60 cell line set. Mol Cancer Ther. 2006;5:2606–2612. - PMC - PubMed
    1. Barretina J, Caponigro G, Stransky N, Venkatesan K, Margolin AA, Kim S, et al. The Cancer Cell Line Encyclopedia enables predictive modelling of anticancer drug sensitivity. Nature. 2012;483:603–607. - PMC - PubMed
    1. Greenblatt MS, Bennett WP, Hollstein M, Harris CC. Mutations in the p53 tumor suppressor gene: clues to cancer etiology and molecular pathogenesis. Cancer research. 1994;54:4855–4878. - PubMed
    1. Riley T, Sontag E, Chen P, Levine A. Transcriptional control of human p53-regulated genes. Nat Rev Mol Cell Biol. 2008;9:402–412. - PubMed
    1. Chipuk JE, Green DR. Dissecting p53-dependent apoptosis. Cell death and differentiation. 2006;13:994–1002. - PubMed

Publication types