

Interaction between Her2 and Beclin-1 proteins underlies a new mechanism of reciprocal regulation
- PMID: 23703612
- PMCID: PMC3711298
- DOI: 10.1074/jbc.M113.461350
Interaction between Her2 and Beclin-1 proteins underlies a new mechanism of reciprocal regulation
Abstract
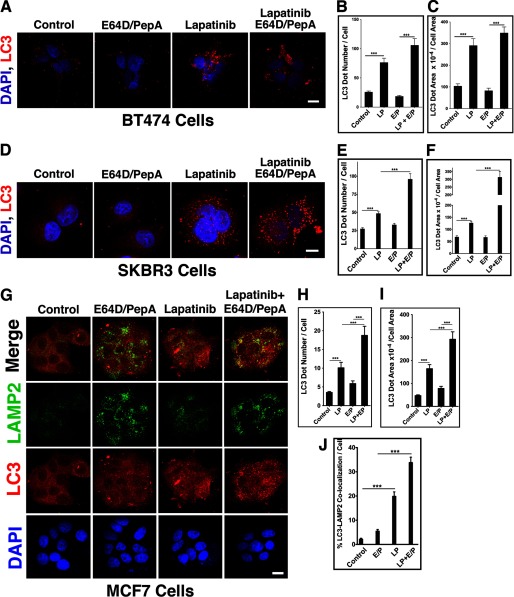
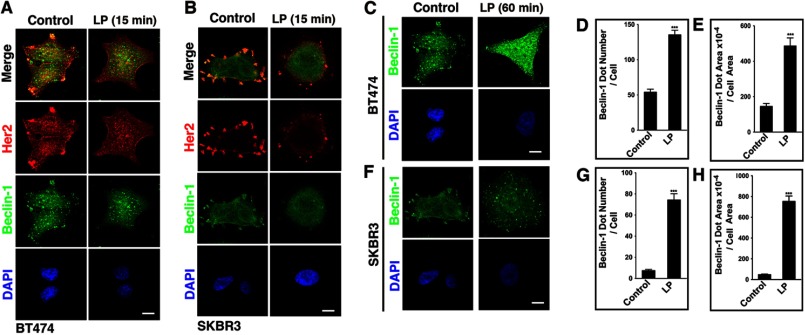
Beclin-1 is a key regulator of autophagy that functions in the context of two phase-specific complexes in the initiation and maturation of autophagosomes. Its known interacting proteins include autophagy effectors, Bcl-2 family members, and organelle membrane anchor proteins. Here we report a newly identified interaction between Beclin-1 and the protein tyrosine kinase receptor Her2. We demonstrate that in Her2-expressing breast carcinoma cells that do not succumb to lapatinib, this Her1/2 inhibitor disrupts the cell surface interaction between Her2 and Beclin-1. The data suggest that the ensuing autophagic response is correlatively associated with the release of Beclin-1 from its complex with Her2 and with the subsequent increase in cytosolic Beclin-1. Upon its interaction with Her2, Beclin-1 up-regulates the phosphorylation levels of Her2 and Akt. The Beclin-1 evolutionarily conserved domain is required both for the interaction of Beclin-1 with Her2 and for the increased Her2 and Akt phosphorylation. These findings shed new light on mechanisms involved in lapatinib-mediated autophagy in Her2-expressing breast carcinoma cell lines and in Beclin-1 signaling in these cells.
Keywords: Apoptosis; Autophagy; Beclin-1; Breast Cancer; Epidermal Growth Factor Receptor (EGFR); Her2; Lapatinib; Receptor Tyrosine Kinase.
Figures


Similar articles
-
Roles of BIM induction and survivin downregulation in lapatinib-induced apoptosis in breast cancer cells with HER2 amplification.Oncogene. 2011 Sep 29;30(39):4097-106. doi: 10.1038/onc.2011.111. Epub 2011 Apr 18. Oncogene. 2011. PMID: 21499301
-
Lapatinib induces autophagic cell death and inhibits growth of human hepatocellular carcinoma.Oncotarget. 2014 Jul 15;5(13):4845-54. doi: 10.18632/oncotarget.2045. Oncotarget. 2014. PMID: 24947784 Free PMC article.
-
PTK6 inhibition promotes apoptosis of Lapatinib-resistant Her2(+) breast cancer cells by inducing Bim.Breast Cancer Res. 2015 Jun 19;17(1):86. doi: 10.1186/s13058-015-0594-z. Breast Cancer Res. 2015. PMID: 26084280 Free PMC article.
-
Impaired autophagy and APP processing in Alzheimer's disease: The potential role of Beclin 1 interactome.Prog Neurobiol. 2013 Jul-Aug;106-107:33-54. doi: 10.1016/j.pneurobio.2013.06.002. Epub 2013 Jul 1. Prog Neurobiol. 2013. PMID: 23827971 Review.
-
The molecular mechanisms between autophagy and apoptosis: potential role in central nervous system disorders.Cell Mol Neurobiol. 2015 Jan;35(1):85-99. doi: 10.1007/s10571-014-0116-z. Epub 2014 Sep 26. Cell Mol Neurobiol. 2015. PMID: 25257832 Free PMC article. Review.
Cited by
-
Erb-b2 Receptor Tyrosine Kinase 2 (ERBB2) Promotes ATG12-Dependent Autophagy Contributing to Treatment Resistance of Breast Cancer Cells.Cancers (Basel). 2021 Mar 2;13(5):1038. doi: 10.3390/cancers13051038. Cancers (Basel). 2021. PMID: 33801244 Free PMC article.
-
Autophagy inhibition by TSSC4 (tumor suppressing subtransferable candidate 4) contributes to sustainable cancer cell growth.Autophagy. 2022 Jun;18(6):1274-1296. doi: 10.1080/15548627.2021.1973338. Epub 2021 Sep 17. Autophagy. 2022. PMID: 34530675 Free PMC article.
-
COTE1 Facilitates Intrahepatic Cholangiocarcinoma Progression via Beclin1-Dependent Autophagy Inhibition.Biomed Res Int. 2023 Sep 22;2023:5491682. doi: 10.1155/2023/5491682. eCollection 2023. Biomed Res Int. 2023. PMID: 37780485 Free PMC article.
-
BECLIN1: Protein Structure, Function and Regulation.Cells. 2021 Jun 17;10(6):1522. doi: 10.3390/cells10061522. Cells. 2021. PMID: 34204202 Free PMC article. Review.
-
EGFR Family Members' Regulation of Autophagy Is at a Crossroads of Cell Survival and Death in Cancer.Cancers (Basel). 2017 Mar 24;9(4):27. doi: 10.3390/cancers9040027. Cancers (Basel). 2017. PMID: 28338617 Free PMC article. Review.
References
-
- Mariño G., Madeo F., Kroemer G. (2011) Autophagy for tissue homeostasis and neuroprotection. Curr. Opin. Cell Biol. 23, 198–206 - PubMed
-
- Shen S., Kepp O., Kroemer G. (2012) The end of autophagic cell death? Autophagy 8, 1–3 - PubMed
-
- Ito H., Daido S., Kanzawa T., Kondo S., Kondo Y. (2005) Radiation-induced autophagy is associated with LC3, and its inhibition sensitizes malignant glioma cells. Int. J. Oncol. 26, 1401–1410 - PubMed
Publication types
MeSH terms
Substances
Grants and funding
LinkOut - more resources
Full Text Sources
Other Literature Sources
Research Materials
Miscellaneous
